Water Quality Monitoring
Water Quality Analysis of Antipoison Creek
We have been collecting water quality data on Antipoison Creek for about 11 months now, sampling for nitrate-nitrites (NO23), phosphates (PO4), ammonium (NH4), and chlorophyll. Our data collection extends from last September to this May (with sampling ongoing). Last month, Gary, Libby and I visited with Dr. Lora Harris, an associate professor at the University of Maryland’s Center for Environmental Science (UMCES), who specializes in systems ecology and ecosystem modeling, to get input on how to analyze our water quality data.
Dr. Harris gave us several suggestions, one of which was to create a Nitrogen Loading Model (NLM) for Antipoison Creek, to determine if the creek is primarily fed by nitrogen coming in from the Chesapeake Bay, or from the watershed (land-based activity and runoff, groundwater leaching, and atmospheric deposition). Harris described the NLM as a type of box model, showing inputs and outputs in and from a watershed. (See Figure 1, from the NLM instruction manual below).

The Nitrogen Loading Model, created by Mark J. Brush (VIMS), Lora A. Harris (UMCES), Juliette C. Giordano (VIMS), and Joanna K. York (UDEL) allows a user to put in data on land use and activity in a specific watershed- for us, Antipoison Creek. The model pulls in miscellaneous information on the watershed, such as atmospheric deposition, loads from point sources, and surface area of the creek. It also pulls in data on non-agricultural and agricultural land cover, as well as the fertilization rate and agricultural yield of each crop grown in the watershed.
Using a mix of applications including a GIS operating system (QGIS) and GoogleEarth, as well as a number of sources on Antipoison Creek and Lancaster County, we came up with estimates for the needed parameters. Once all the inputs were entered, and the model generated kilograms of nitrogen for groundwater input, wastewater input, direct atmospheric deposition onto water surface, and a total annual load of nitrogen (kg) entering the watershed, we contacted Dr. Brush to discuss our procedure and results.
Now that we have an annual watershed load for nitrogen to the estuary, we must determine if Antipoison Creek has a greater flux of nitrogen coming from the watershed and emptying out into the Bay, or if the Bay is primarily feeding the creek with an influx of nitrogen.
We will be working with Dr. Brush on this next step, as well as a more in-depth paper to share our work on the NLM model.
Source: Brush, M.J., L.A. Harris, J.C.P. Giordano, and J.K. York. 2015. Delmarva Coastal Bays Nitrogen Loading Model. Virginia Institute of Marine Science, Gloucester Point, VA. Available at: http://www.vims.edu/research/departments/bio/programs/semp/models/index.php.
Water Quality Testing Data on Potomac River, Antipoison Creek
We’ve been working with the Nutrient Analytical Services Laboratory (NASL) at the University of Maryland Center for Environmental Science’s Chesapeake Bay Laboratory for several months now, analyzing water quality in the Potomac River and Antipoison Creek (a small tributary of the Chesapeake Bay on Virginia’s Northern Neck). NASL provides the analytical services for phosphates, nitrates, ammonium, and various forms of chlorophyll (total, active, and phaeophtin), from water samples that we collect, and filter in preparation for analysis. We also measure pH and salinity of these samples. For more on procedures, please see my previous post here.
The sampling sites on the Potomac River are found just north of Riverbend Park’s visitor center. Samples here are collected on foot, with a swing sampler, at three locations (with two samples taken per location, samples “A” and “B” in the data shown below). The Antipoison Creek samples are taken via boat at five or six locations(also with two samples taken per location). Sampling is generally conducted once a month on both bodies of water, or after an extreme precipitation event. Sampling began on Antipoison Creek this past September, and on the Potomac River this past January.
Now that we have a few months of data, we would like to share them here.
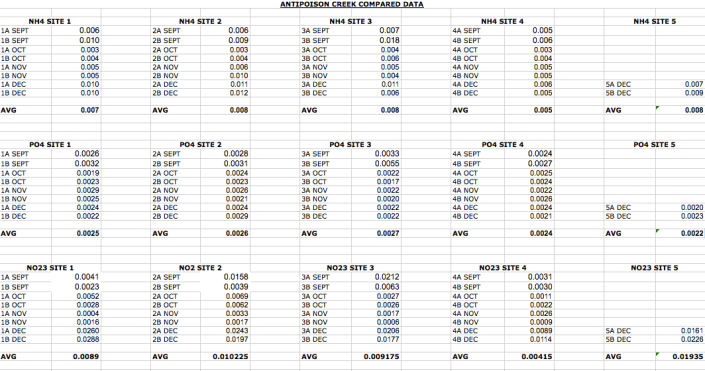
The following is ammonium (NH4), phosphate (PO4), and nitrate (NO23) levels, and their averages, at Antipoison Creek from September to December of 2015. We did not start testing for chlorophyll until December of 2015, and only have one month’s worth of data for those parameters.
The following is ammonium (NH4), phosphate (PO4), and nitrate (NO23) levels, and their averages, on the Potomac River from January and February from this year.
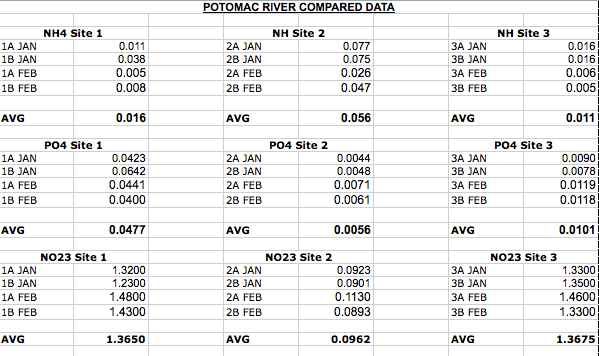
Comparing between sampling locations, ammonium, phosphate and nitrate averages from the Potomac River samples are significantly higher than the Antipoison Creek samples. The Antipoison Creek watershed is rural. There is some agriculture going on in the fields surrounding the creek, along with low-density residential development. Antipoison has a great deal of oyster aquaculture taking place within the creek, with personal oyster floats off residential properties, and a commercial production facility located at the mouth of the creek (with thousands of oysters being grown in the vicinity). This is likely having a significant impact on water quality.
The Potomac River watershed, in the area where we are testing, is much more densely populated. Nutrient levels, such as phosphates and nitrates, might be higher due to higher concentrations of polluted runoff coming from suburban developments. There are also no oysters acting as a natural filtration system in this part of the watershed. It will be interesting to compare chlorophyll levels between these locations once enough data is retrieved and analyzed. We’ll keep you posted!
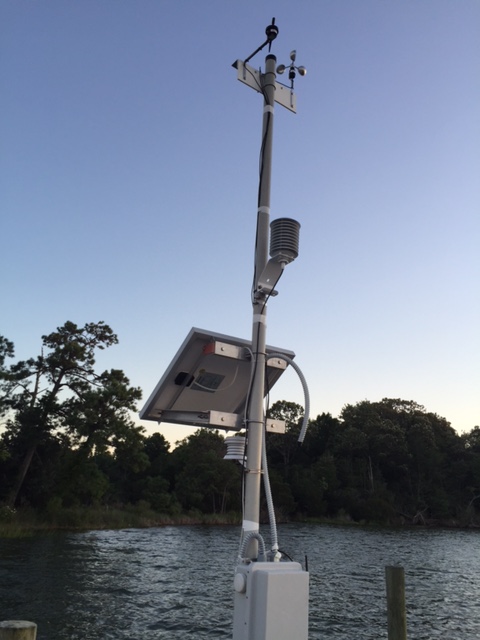
Weather Station Up and Running
By Gary Greenwood:
I finally have our custom weather station working on our dock on Antipoison Creek on the Northern Neck. This is a key part of our water-monitoring project. The weather station collects normal weather info, as well as water depth and water temperature. The next step is to add data collection for a variety of water quality metrics, including dissolved oxygen, salinity and PH. By collecting all these values over a period of time, we will be able to look for correlations between the weather and water quality.
This weather station is totally custom, using quality off-the-shelf sensors integrated with custom software running on an Arduino. In addition to storing the data within our internal database, the information is also available on weather underground at KVAWHITE14.
I used a variety of components to build this station:
- Arduino Mega 2560 microcontroller
- Xbee radio to send the info from the dock to a computer in the house
- 30-amp solar panel, since there is no continuous AC power on the dock.
- Genasun charge controller and Panasonic 7.2AH battery to manage and store the solar for nights and shady days.
- Inspeed Vortex II anemometer.
- Inspeed E-vane
- Rotronic HC2-S3 temperature and humidity sensor from Campbell Scientific with 10-layer radiation shield
- Bosch BMP180 Barometric Pressure sensor from Adafruit
- Keller Acculevel water level transmitter, including water temperature
- Apogee SP-212 pyranometer
- Adafruit DS18B20 temperature (backup for the Rotronic)
- It’s all mounted on a two-part fiberglass mast from DXEngineering. The mast is screwed to the dock and one of the pilings.
See picture of the weather station below: