Uncategorized
Microplastics in Antipoison Creek
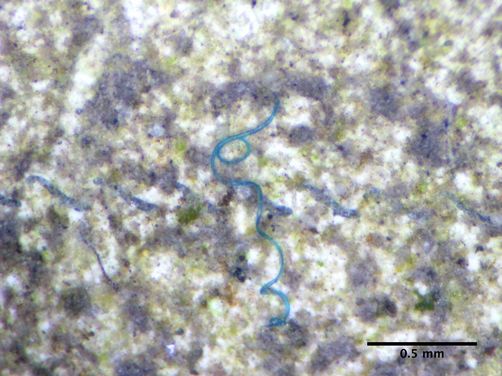
If you remember, last December G2 sent in water samples from Antipoison Creek to Abby Barrows at Adventure Scientists (see this former post). Abby has been documenting the presence of microplastics in global waters. Microplastics are bits of microscopic plastic debris. A major source of this debris is clothing. As synthetic fibers (many clothing items such as fleeces are made with synthetic fibers) are put through the washing machine, plastic debris from these items come out of homes as wastewater, and eventually make their way to streams, rivers and oceans. Preliminary evidence suggests that marine species are reacting negatively to the ingestion of microplastics. The team at Adventure Scientists has been accepting water samples from around the globe to determine how prevalent pollution from microplastics is. You can check out their online map to see which waters have not been sampled yet, and sign up to sample if you see an opportunity to contribute.
G2 received results from the Antipoison Creek samples. One blue microfiber was found from our samples. The results were shared via the Adventure Scientists blog here, which also includes a post on Abby’s lab process and overall project results thus far. Go check it out!
Chesapeake Bay Report Card Released
The University of Maryland’s Center for Environmental Science (UMCES) has issued their annual report card on the health of the Chesapeake Bay watershed for 2016. This report examines several factors, including water quality, fisheries, and vegetative growth. Contributing factors are examined individually and the Bay is given an overall score based on these factors. This year, UMCES awarded the Bay watershed a C grade for the 2016-reporting year. While the letter grade remains unchanged from former years (going back to 2012), Bay health has improved by 1% since 2015- up to 54%.
This year’s online report is somewhat more interactive than in previous years, and includes some great graphics and graphs comparing Bay health indicators over time. I encourage readers to check out the report themselves here, however, to sum up these individual indicators:
- Overall health improved in certain segments of the Bay, most noticeably in the Lower Bay (adjacent to Virginia’s Middle Peninsula and Virginia Peninsula on the Western shore).
- Dissolved oxygen levels remained at relatively good levels throughout 2016. Dissolved oxygen levels are a major concern in the mainstem of the Bay during the summer months, when water temperatures rise, water is still/stagnant reducing the mixing of fresh and saltwater, and nutrient pollution contributes to algal blooms. These factors reduce oxygen levels needed by marine species.
- Total nitrogen decreased slightly from 2015. The best results were seen in the Lower Bay (which scored highest for overall health), and in the James and Rappahannock Rivers (which feed directly into the Lower Bay). Total nitrogen levels were highest in portions of the Bay adjacent to the Lower Eastern Shore and in the Upper Bay. Higher nutrient levels seem to correlate with the location of big agricultural regions. Agricultural runoff from poultry farms on the Eastern Shore and from the ag-rich northern reaches of the watershed in Pennsylvania and Maryland are likely major contributors to these higher nitrogen levels. The Potomac River also scored poorly for total nitrogen, likely due to a mix of agricultural runoff and urban/stormwater runoff.
- Total phosphorus levels were good overall. The mainstem of the Bay scored the highest, while certain tributaries -the James and York Rivers – had poor scores.
- Chlorophyll a levels were poor throughout the Bay, scoring a D in all but the Upper Bay and Lower Eastern Shore (C), and the James River (B). UMCES attributes high chlorophyll a levels to elevated nutrient availability.
- Water clarity overall was poor or very poor throughout the Bay. The only exception was the highest rated Middle Bay, which received a C score.
- Aquatic grass abundance continues to be an issue in the Bay. Overall, acreage of submerged aquatic vegetation has steadily declined since the mid-to-late twentieth century. Certain areas have seen improvements since 2012. The Rappahannock River, Lower Eastern Shore and Upper Bay scored the highest for aquatic grasses, with a B grade. I cannot comment on the other portions of the Bay, but the Rappahannock River ranking is consistent with what we have been observing where we take water samples – in Virginia’s Antipoison Creek and Little Bay – where we saw Bay grasses return last spring. These grass beds show signs of returning this year.
- The benthic community refers to bottom-dwelling and filter-feeding organisms. In the Chesapeake Bay, the benthic community includes (but is not limited to) bacteria, worms, clams and oysters. I believe the oysters scored in this report refer only to native oyster populations. Overall, the benthic community had a decreased score from the previous two years. All but the Lower Eastern Shore (B) and the Lower Bay (A) scored low. The Middle Bay and Potomac River had very poor scores. The benthic community is impacted by nutrient, sediment and dissolved oxygen levels. The community fared best where both total nitrogen and dissolved oxygen levels also scored well (the Lower Bay).
- Blue crabs scored very well throughout the Bay (A), relating back to 2016 survey results.
- Bay anchovy and striped bass also scored an A throughout the entire Bay. Conditions for these indicators have been consistent since 2012.
Conditions in the Lower Bay are consistent with what we have been seeing at Antiposion Creek (at the very tip of the Northern Neck where the Rapphannock River meets the Bay; the Rapphannock River is the dividing line between the Northern Neck and Virginia’s Middle Peninsula)- aquatic grasses are returning; the crab population was abundant last summer, according to local watermen; our nutrient levels coming back in our sample analysis show a generally healthy watershed.
Agriculture is still a major land use in the Lower Bay watershed. However, it would be interesting to study how land use in the Lower Bay has changed from agricultural or commercial waterfront operations to residential, compared to the agricultural areas in the Upper Bay and Eastern Shore, where overall health was poorer. Perhaps this land use change, if the difference is significant enough between the Upper and Lower Bay watershed, is influencing health indicators. The Lower Bay has also seen an influx of commercial and recreational oyster production in its waters (something that has not been adopted to the same extent in Maryland). This too is likely impacting nutrient levels in the Lower Bay.
Microplastics
Last month, the Washington Post published a piece on the presence of microplastics in waters all across the globe. The article featured the work of scientist Abby Barrows at Adventure Scientists, who has been collecting water samples from citizens to document the presence of microplastics.
You’ve probably heard a lot about the levels of plastic waste in our oceans. Marine birds and animals are susceptible to ingesting or strangling on large pieces of debris. What scientists are now discovering is that many of our waters have microscopic levels of plastics in them. While these microplastics pose different hazards than plastic debris, marine species could equally be as threatened. More studies need to be conducted, but there is preliminary evidence that ingesting microplastics has a negative impact on the eating habits and growth rates of marine species. Microplastics can come from a number of sources, including clothing and cosmetics. The US has already introduced a ban on microbeads in cosmetic products, with microbeads set to be phased out by 2019. However, the synthetic fibers used in the production of many of clothes (particularly fleeces), shed microplastics when washed.
Microplastics have been found throughout the world’s oceans. The Adventure Scientists are looking into how widespread pollution is. Their website features a map of all the places and watersheds where microplastics have been detected so far. I encourage you to check it out and see where there are gaps. If you plan on travelling, or if you live in an area where samples would be needed, all you have to do is sign up, read through the procedures, and take a short quiz in order to participate in sampling. They’re particularly interested in freshwater at the moment.
As G2 was already scheduled to sample in Antipoison Creek and Indian Creek earlier in November, we signed up to sample for microplastics as well. The results take about 6 to 8 weeks to come back, so we will be sure to share them as they become available!
Updates
By Kathleen
Sorry things have been silent around here on my end. I have been working “offline” on modeling and water quality analysis on several tributaries in Virginia’s Lancaster County. With input and feedback from Professor Mark Brush at VIMS, we have completed a tidal prism and two versions of a Nitrogen Loading Model (NLM) for Antipoison Creek. These NLMs show annual loads of nitrogen to the creek, but since local agricultural fields transition between corn and winter wheat at different times of the year, we have a model for each crop. I will upload a more detailed account of our findings in the next few days.
We have also begun to water sample at the neighboring Indian Creek. Dependent on time and resources, we will complete NLMs for Indian Creek, and the Corrotoman River (where water quality monitoring is conducted by an outside source and collected by the Chesapeake Bay Program).
Mid-Summer Bay Dead Zone Data Released
Earlier this summer, I reported on estimates that the Bay hypoxic zone would be smaller than average this year. The Maryland Department of Natural Resources (DNR) has just released their data for dissolved oxygen levels for July and early August in the main stem of the Bay (see this report). While the hypoxic area in August was about average, July measurements exceeded estimates.
To refresh, hypoxic zones are areas where dissolved oxygen levels fall below 2 milligrams per liter. Anoxic zones, which have not occurred this year, are areas where oxygen levels fall below 0.2 milligrams per liter. Hypoxic and anoxic zones are commonly referred to as dead zones, as low oxygen levels make it difficult for marine species to live in these areas.
Earlier estimates, made by a team of scientists from UMCES, the University of Michigan, NOAA and USGS, were calculated from spring rainfall and nutrient loading data from major Bay tributaries, such as the Susquehanna and Potomac Rivers. Spring rainfall, which carries nutrient runoff into the main stem of the Bay, is a major indicator of how big or small dead zones may be later in the year.
Measurements of dissolved oxygen are then taken throughout the summer months. Data is collected by the DNR, and compared to long-term averages (1985-2015).


July dissolved oxygen levels, and the subsequent hypoxic zone area, were higher than average. The hypoxic zone grew to 1.65 cubic miles last month, which was the seventh largest hypoxic zone on record in the Bay. (The July long-term average is 1.29 cubic miles). Early August levels were closer to estimates; the August 2016 (Aug 8-10) hypoxic zone measured 1.15 cubic miles, compared to the 1.13 cubic mile average.
Dissolved oxygen is measured with various other water quality indicators, which can give scientists a better idea of what causes average or above average dead zones. This year, scientists measured higher salinity in the Bay in June through early August. Higher salinity is indicative of less rainfall and less nutrient runoff. In wetter years, more nutrient runoff usually results in larger hypoxic zones. The results for early August confirm spring estimates. With the drier spring we had this year, we would expect to see average or lower than average dissolved oxygen levels, hypoxic zone areas, and salinity measurements.
But what about July? Why was the hypoxic zone so much larger than average? Other environmental factors, such as temperature, were likely to blame. July temperatures were especially high last month. Warmer air and water temperatures result in stagnant waters; oxygen on the Bay surface is unable to mix with bottom waters, where species such blue crabs, oysters, and finfish can be found.
Monitoring of the Bay hypoxic zone concludes in September. Check back for an update in a few weeks when the late August/ early September data is released.
A Review of Chesapeake Oysters: The Bay’s Foundation and Future
Did you know that oyster aquaculture has been practiced and debated in the Chesapeake region since the late 1800s? William K. Brooks, a researcher with the Chesapeake Zoological Laboratory, was the first to experiment with Chesapeake oyster production in a controlled environment. Brooks, funded by the state of Maryland in the 1880s, studied and promoted ways in which oysters could be farmed to prevent against overharvest of natural oyster reefs. While hugely unpopular among the public, and especially among those in the oyster industry in his time, Brooks’ findings are used today in the booming oyster aquaculture industry.
Kate Livie, the director of education at the Chesapeake Bay Maritime Museum at St. Michael’s, Maryland, shares stories such as Brooks‘ in her 2015 book, Chesapeake Oysters: The Bay’s Foundation and Future. Live gives a fascinating account of the rise and fall and current renaissance of the Chesapeake oyster industry.
Livie’s begins her book by introducing the Chesapeake oyster and its importance in this region, by using historical accounts and anthropological evidence to describe pre- and post-colonial reliance on the oyster as major source of food. Livie argues that oysters were the foundation for colonial settlement in the Chesapeake region, and continued to be a staple in the regional diet over the next century.
Livie goes on to detail the rise of oyster harvesting in the Chesapeake Bay, which became an economic and cultural cornerstone of the region. Cities and towns, like Baltimore and Crisfield, grew in size and prominence during the oyster boom of the mid- to late-1800s. Packinghouses employed thousands of workers, charged with shucking, packaging, and shipping oysters out from the Bay region to other parts of the country.
Industrialization and advances in technology allowed watermen and packinghouses to produce, package, and ship out oysters at an unprecedented rate. They were able to do so as national demand for oysters rose. Chicago, New York, and New England were major consumers of Chesapeake oysters, as many of these places had wiped out their own native oyster beds. As a great number of packinghouses sprang up in the Chesapeake watershed, Livie paints a vivid picture of the efforts these places used to stand out. Unique and colorful cans, trade cards and advertisements for Chesapeake oysters could be found in restaurants and markets along the Eastern seaboard.
With the massive scale of oyster production going on in the nineteenth and early twentieth centuries, watermen adopted new methods, such as dredging, to harvest oyster reefs. Dredging and overharvesting led to the depletion of natural reefs and major reductions of stock. Dredging caused vertical reefs to become horizontal in structure, and made oysters more susceptible to sedimentation, and disease. This susceptibility was no more apparent than in the second half of the twentieth century, when the diseases MSX and Dermo reached the Chesapeake Bay watershed. MSX and Dermo wiped out much of -what was already- a severely depleted oyster population. Populations remain low to this day; current reports estimate that the Chesapeake oyster population is just 1% of historic levels.
Due to disease and overharvest, oyster production was a dying industry in the Chesapeake region until the early 2000s, when scientific researchers discovered a way to harvest an oyster immune to MSX and Dermo, and released this oyster to the market. The discovery of a disease-resistant triploid oyster, unable to reproduce and create spat, has resuscitated the industry. However, this revival is a complete turnaround from natural methods of harvest. Unable to form natural reefs, the triploid oyster must be farmed. Traditional oyster harvesters have been reluctant to switch to aquaculture, especially in Maryland where an aversion and distrust of oyster farming goes back to the days of William K. Brooks.
Virginia on the other hand, has been much more open to oyster aquaculture, historically and with the recent emergence of the disease-resistant triploid. While farming has had a slow start in Maryland, dozens of private oyster farming businesses popped up over the past ten years in Virginia (54 farms registered as of 2013). Outside of farming, hundreds of individuals throughout Virginia raise not-for-profit oysters in floating cages. On this explosion of aquaculture in Virginia, Livie states that from the time VIMS began tracking aquaculture, “Hatchery-produced seed plantings grew from 6.2 million in 2005 to 138 million in 2014- an increase of over 2,125 percent in less than a decade.”
If you want to read more about the emergence of aquaculture in the Chesapeake Bay watershed, or learn more about the history of the oyster in this region, pick up Livie’s book. It’s a great read.
[Livie, Kate. Chesapeake Oysters: The Bay’s Foundation and Future. Charleston: American Palate, 2015.]
UMCES Gives a C Grade for 2015 Bay Health in Latest Report Card
The University of Maryland’s Center for Environmental Science (UMCES) recently released their report card on the health of the Chesapeake Bay for 2015. The Bay watershed received a grade of a C, which in comparison to past years, is pretty good. Last year’s grade was a D+; the Bay has not received a grade at or higher than a C since 2002.
The score is calculated by analyzing measurements and factors throughout the different segments of the Bay such as streamflow, fish populations, water clarity, levels of nutrients (total nitrogen and phosphorus), acreage of underwater grasses, types and levels of benthic macroinvertebrates, levels of dissolved oxygen and chlorophyll. Each of the following segments of the Bay receives a grade, and the overall score is an average of these areas (individual grades can be found on page 4 of the report).
The segments of the Bay that were analyzed and scored are:
- Upper Western Shore
- Upper Bay
- Patapsco and Back Rivers
- Lower Western Shore (MD)
- Upper Eastern Shore
- Patuxent River
- Choptank River
- Potomac River
- Lower Eastern Shore (Tangier)
- Rappahannock River
- Mid Bay
- York River
- Lower Bay
- James River
- Elizabeth River
Improvements were found for almost all of the measurements listed above, compared to recent years. Total phosphorus levels in the Bay, however, increased from last year, despite models showing a decrease in phosphorus loadings from tributaries. Further study is needed to explain this.
UMCES points out that only two other years – 2002 and 1992 – had scores as good as 2015. However, 2002 and 1992 were drought years, while 2015 was not. (Drought years are generally good years for water clarity, and nutrient and sediment levels, as there is less runoff entering and polluting the Bay and Bay tributaries). So a question this latest report leaves us with is: Is water quality in the Bay improving? Or is the higher score attributed to other factors, such as the milder water temperatures of last summer?
Dry Fall Contributes to Clearer Water in the Chesapeake
The Chesapeake Bay has been reportedly clearer this season. Bay waters start to get less murky as temperatures drop (and algae growth slows) in autumn and winter. However, Bay-front residents have been impressed by just how clear waters have been recently.
Clear waters signify lower nutrient and sediment levels and improved water quality throughout the Bay. With fewer pollutants present, sunlight can reach submerged aquatic vegetation (underwater grasses), that act as important sources of shelter and food for finfish, shellfish and other aquatic species.
This season’s improved water clarity is likely attributed to low levels of precipitation this past fall. Less rain translates to less runoff, which brings nutrients and sediments into the estuary from freshwater sources. The Susquehanna River, the largest contributor to nutrients and sediments in the Bay Watershed, had, according to the USGS, two-thirds the rate of its average flow into the Bay this past September and October. The Susquehanna generally discharges large loads of nitrogen and phosphorus into the Bay, due to the large amount of agricultural activity that takes place within this subwatershed.
We saw indicators of good water quality (with low nitrate and phosphate levels) in Antipoison Creek this September, where waters have also been pretty clear. Water samples for the rest of the year were just sent into the laboratory for testing, so we are waiting on these results, which should tell a fuller story on water quality in Antipoison Creek. In terms of long-term water quality results, it will be interesting to see if these good water quality results were influenced by the fall drought of 2015 – if our water quality results were only temporary- or if this particular part of the Bay is in pretty good health.
Source: Pilot Online
Microbeads Banned in US Waters
Good news for the Chesapeake Bay, and watersheds around the nation!
Earlier this month, Congress voted to ban microbeads in common personal hygiene products, such as soaps, toothpastes and facial cleansers. The bill – the Microbead-Free Waters Act of 2015- was passed by the House of Representatives first, and then the Senate on December 18. President Obama signed the bill into law yesterday.
Microbeads, found in many health and beauty products, cause major problems in watersheds. The beads, which are rinsed down the drain with use, are too small to be filtered out in wastewater treatment plants, and end up directly in our waterways. These beads, which are plastic, adhere to PCBs (polychlorinated biphenyls) in streams and estuaries, and are toxic to marine animals. Toxins make their way up the food chain, and have been found in significantly high concentrations in fish in watersheds such as the Great Lakes.
Nine states, and several municipalities around the country, have already passed bans on products with these beads, but this is the first nationwide bill of its kind. With the Microbead-Free Waters Act, all production of microbeads will be phased out of personal care products by July 1, 2017, with production phase out of microbeads in over-the-counter drugs and cosmetics to follow in July 2018 (with a ban on sales enforced by July 2019).
To read more about plastic debris in the Chesapeake Bay, CityLab has a post on Julie Lawson’s (director of Trash Free Maryland) efforts to document plastic concentrations in Bay waters. Lawson’s team has found plastic debris from what they suspect comes from film associated with mulching on watershed farms. If or when the lab working on these water samples confirms this, our region will likely face a fresh set of challenges, revolving around the phase-out of harmful products from the agricultural sector.
Sources: New York Times, Washington Post, Detroit News
Water Quality Monitoring on Antipoison Creek
This autumn, I have begun water quality monitoring on Antipoison Creek, a small tributary of the Chesapeake Bay, located on Virginia’s Northern Neck. I have been collecting and preparing water samples for analysis of nitrates, phosphates, ammonium, and chlorophyll, and working with the University of Maryland Center for Environmental Studies’ Nutrient Analytical Services Laboratory (NASL) on advanced analytical services for these water chemistry results.


Water sampling bottles are prepared using an acid wash procedure, to ensure that no remaining particles from manufacturing or previous water samples corrupt the results. When the bottles are ready, I collect samples from four locations via kayak along Antipoison Creek (2 samples per location, using a three-sample rinse method).
The first location is upstream from the beach from where I depart; the second location is several feet in front of the beach. The third and fourth locations are further downstream, at the mouth of Little Bay, (shown on the map below as Fleet’s Bay- Little Bay lies just between Fleet’s Bay and the mainland).
Once the samples are collected, they are filtered and divided into auto analyzer cups to be tested for nitrate, phosphate, and ammonium levels at NASL. (See photo below). Samples are frozen until they can be transported to the lab.


The samples must be filtered differently for chlorophyll- the lab receives just a filter pad for this, no water samples.
It took a little longer to get all of the supplies for the chlorophyll filtering procedure, and I have yet to send in samples for chlorophyll testing. However, the first results for nitrates, phosphates and ammonium recently came in. The ammonium test results have to be crosschecked with the pH levels of the samples, but I was able to read the phosphate and nitrate results.
According to North Carolina State University, phosphate designated use limits for estuaries, in order to support maximum diversity of aquatic life, must be 0.01 mg/L; for moderate diversity the phosphate limit is 0.1 mg/l.
Recommended nitrate limits are 0.1 mg/l for maximum diversity, and 1.0 mg/l for moderate diversity.
The results we received for phosphate (PO4) and nitrates (NO23) from Antipoison Creek were as follows (see bolded figures):

The results for phosphates and nitrates are significantly lower than limits set for water quality standards– which is a good thing- it means there is not an excess level of nutrients in the water, which can impair aquatic life. There is a significant amount of oyster production taking place in this sample area- oysters are natural filterers of nutrients and sediment. Perhaps this has an impact on our results. This is only one month’s results, however, (September), and results from following months must be compared before further analysis can be made.
Future chlorophyll readings will give an indication of algae levels in the sample region. Ammonium is another type of nitrogen in waters- it is produced when plants and animals decompose, and is present in animal waste. It acts as a pollutant when levels are too high, impacting local aquatic species. We should be seeing low results for ammonium as well to indicate good water quality in this portion of Antipoison Creek.
