Month: May 2017
Climate Change in Delaware Bay
Ted Williams wrote a piece this week for Yale Environment 360 on the impact climate change is having on the Delaware Bay. Although this estuary is much smaller than the Chesapeake Bay (782 square miles to the Chesapeake’s 64,299 square miles), the two watersheds have a lot in common, in terms of geographic location, features, and marine and shorebird species. The changes Williams sees occurring in Delaware Bay are either issues we are currently seeing in the Chesapeake, or could be a sign of changes to come.
The most dramatic change occurring in the Delaware Bay is the loss of tidal wetlands due to sea level rise and erosion. The watershed is losing an acre a day of its wetlands. With rate loss expected to increase, by 2100, 90% of these wetlands may be lost.
Wetland loss impacts lifecycle processes of several species. Atlantic menhaden larvae require tidal marshes. Ribbed mussels (an important filter feeder in the Bay) form tight-knit clusters in marshes; erosion makes the mussels more susceptible to predation.
Sea level rise contributes to beach erosion and shoreline tree loss. Horseshoe crabs, which use beaches in the Delaware Bay watershed as spawning grounds, are losing their grounds to sea level rise. Some shorebird species dependent on horseshoe crab eggs, such as the red knot, are at risk from these environmental changes.
Certain species in the Delaware Bay may see short-term benefits from climate change. With fewer freezes occurring, Delaware Bay oysters can survive in intertidal zones. However these now warmer zones are hosts to diseases (MSX and Dermo) and predators (oyster drills).
Warmer waters exacerbate pollution issues. Nutrients build up, dissolved oxygen can decrease, and algal blooms can increase in frequency.
The Chesapeake Bay is also experiencing shoreline loss and erosion. Places like Dameron Marsh and Hughlett Point in Virginia have been discussed here previously in terms of erosion and sea level rise. Naturally warmer waters in the Bay mean that diseases such as MSX and Dermo have been impacting native oysters for decades. It will be interesting to see how warmer waters -associated with climate change- host new or increased populations of pests/predators for our oysters. Ocean acidification may also be a concern. The changes occurring between species relationships, such as between Delaware’s red knot and horseshoe crab, will certainly be something to look out for in this watershed.
To read Ted Williams’ article, please visit e360.yale.edu.
Microplastics in Antipoison Creek
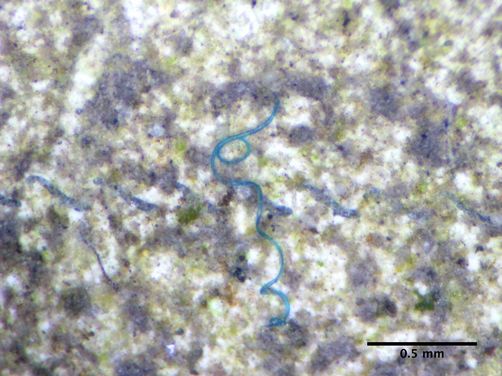
If you remember, last December G2 sent in water samples from Antipoison Creek to Abby Barrows at Adventure Scientists (see this former post). Abby has been documenting the presence of microplastics in global waters. Microplastics are bits of microscopic plastic debris. A major source of this debris is clothing. As synthetic fibers (many clothing items such as fleeces are made with synthetic fibers) are put through the washing machine, plastic debris from these items come out of homes as wastewater, and eventually make their way to streams, rivers and oceans. Preliminary evidence suggests that marine species are reacting negatively to the ingestion of microplastics. The team at Adventure Scientists has been accepting water samples from around the globe to determine how prevalent pollution from microplastics is. You can check out their online map to see which waters have not been sampled yet, and sign up to sample if you see an opportunity to contribute.
G2 received results from the Antipoison Creek samples. One blue microfiber was found from our samples. The results were shared via the Adventure Scientists blog here, which also includes a post on Abby’s lab process and overall project results thus far. Go check it out!
Chesapeake Bay Report Card Released
The University of Maryland’s Center for Environmental Science (UMCES) has issued their annual report card on the health of the Chesapeake Bay watershed for 2016. This report examines several factors, including water quality, fisheries, and vegetative growth. Contributing factors are examined individually and the Bay is given an overall score based on these factors. This year, UMCES awarded the Bay watershed a C grade for the 2016-reporting year. While the letter grade remains unchanged from former years (going back to 2012), Bay health has improved by 1% since 2015- up to 54%.
This year’s online report is somewhat more interactive than in previous years, and includes some great graphics and graphs comparing Bay health indicators over time. I encourage readers to check out the report themselves here, however, to sum up these individual indicators:
- Overall health improved in certain segments of the Bay, most noticeably in the Lower Bay (adjacent to Virginia’s Middle Peninsula and Virginia Peninsula on the Western shore).
- Dissolved oxygen levels remained at relatively good levels throughout 2016. Dissolved oxygen levels are a major concern in the mainstem of the Bay during the summer months, when water temperatures rise, water is still/stagnant reducing the mixing of fresh and saltwater, and nutrient pollution contributes to algal blooms. These factors reduce oxygen levels needed by marine species.
- Total nitrogen decreased slightly from 2015. The best results were seen in the Lower Bay (which scored highest for overall health), and in the James and Rappahannock Rivers (which feed directly into the Lower Bay). Total nitrogen levels were highest in portions of the Bay adjacent to the Lower Eastern Shore and in the Upper Bay. Higher nutrient levels seem to correlate with the location of big agricultural regions. Agricultural runoff from poultry farms on the Eastern Shore and from the ag-rich northern reaches of the watershed in Pennsylvania and Maryland are likely major contributors to these higher nitrogen levels. The Potomac River also scored poorly for total nitrogen, likely due to a mix of agricultural runoff and urban/stormwater runoff.
- Total phosphorus levels were good overall. The mainstem of the Bay scored the highest, while certain tributaries -the James and York Rivers – had poor scores.
- Chlorophyll a levels were poor throughout the Bay, scoring a D in all but the Upper Bay and Lower Eastern Shore (C), and the James River (B). UMCES attributes high chlorophyll a levels to elevated nutrient availability.
- Water clarity overall was poor or very poor throughout the Bay. The only exception was the highest rated Middle Bay, which received a C score.
- Aquatic grass abundance continues to be an issue in the Bay. Overall, acreage of submerged aquatic vegetation has steadily declined since the mid-to-late twentieth century. Certain areas have seen improvements since 2012. The Rappahannock River, Lower Eastern Shore and Upper Bay scored the highest for aquatic grasses, with a B grade. I cannot comment on the other portions of the Bay, but the Rappahannock River ranking is consistent with what we have been observing where we take water samples – in Virginia’s Antipoison Creek and Little Bay – where we saw Bay grasses return last spring. These grass beds show signs of returning this year.
- The benthic community refers to bottom-dwelling and filter-feeding organisms. In the Chesapeake Bay, the benthic community includes (but is not limited to) bacteria, worms, clams and oysters. I believe the oysters scored in this report refer only to native oyster populations. Overall, the benthic community had a decreased score from the previous two years. All but the Lower Eastern Shore (B) and the Lower Bay (A) scored low. The Middle Bay and Potomac River had very poor scores. The benthic community is impacted by nutrient, sediment and dissolved oxygen levels. The community fared best where both total nitrogen and dissolved oxygen levels also scored well (the Lower Bay).
- Blue crabs scored very well throughout the Bay (A), relating back to 2016 survey results.
- Bay anchovy and striped bass also scored an A throughout the entire Bay. Conditions for these indicators have been consistent since 2012.
Conditions in the Lower Bay are consistent with what we have been seeing at Antiposion Creek (at the very tip of the Northern Neck where the Rapphannock River meets the Bay; the Rapphannock River is the dividing line between the Northern Neck and Virginia’s Middle Peninsula)- aquatic grasses are returning; the crab population was abundant last summer, according to local watermen; our nutrient levels coming back in our sample analysis show a generally healthy watershed.
Agriculture is still a major land use in the Lower Bay watershed. However, it would be interesting to study how land use in the Lower Bay has changed from agricultural or commercial waterfront operations to residential, compared to the agricultural areas in the Upper Bay and Eastern Shore, where overall health was poorer. Perhaps this land use change, if the difference is significant enough between the Upper and Lower Bay watershed, is influencing health indicators. The Lower Bay has also seen an influx of commercial and recreational oyster production in its waters (something that has not been adopted to the same extent in Maryland). This too is likely impacting nutrient levels in the Lower Bay.
