Maryland
Mixed News from Blue Crab Survey

Each year the Maryland Department of Natural Resources, in partnership with UMCES and VIMS, conducts a winter dredge survey to estimate blue crab population numbers in the Chesapeake Bay. The survey gathers information on the total number of crabs, as well as the number of adult males, female crabs of spawning age, and juveniles. Total numbers give an indication of the current health of the blue crab population; the number of juvenile and female crabs of spawning age give an indication of future conditions. Spawning age females impact the beginning of the coming harvest season (April to July, now ongoing); juvenile crabs impact the harvest further down the line.
The 2017 survey brought mixed results. Total population decreased in number from last year’s 553 million count to 455 million.
Population numbers of spawning age females must meet a certain threshold to be considered sustainable (70 million). Virginia and Maryland have also adopted a population target of 215 million. This year’s count of females of spawning age was the highest since the survey was first undertaken in 1988, with a number of 254 million, well above the target number. This number increased from last year’s count of 194 million.
Survey results were not so good for adult males – which decreased by 16% – nor for juveniles. The number of juvenile crabs estimated in this year’s dredge survey was the fourth lowest number ever recorded. This decrease could impact the second half of this year’s harvest (Maryland’s crabbing season runs until December 15; Virginia’s season closes November 30). Scientists on the Chesapeake Bay Stock Assessment Committee are likely to release updated management recommendations to Maryland and Virginia later this summer.
Note: To read more about where the winter dredge survey takes place, and how the survey is conducted, please read this piece from Maryland’s Department of Natural Resources.
Sources: WVTF Public Radio, Maryland DNR
The Impact of Catch Share Programs on Chesapeake Fish Landings
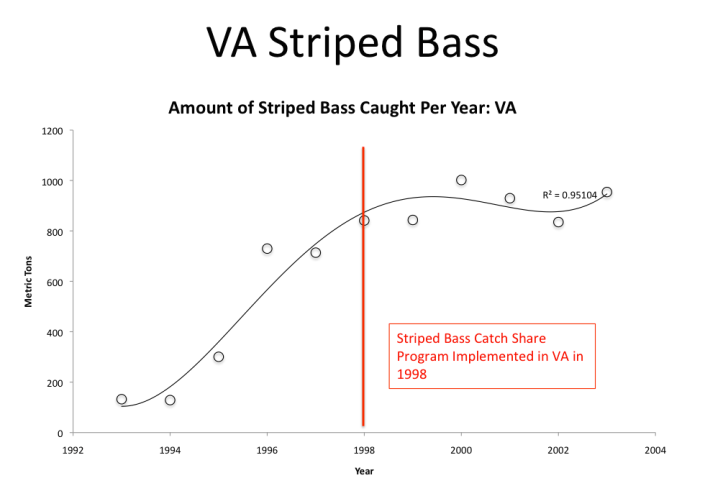
Last week, Libby introduced catch share programs, shared their pros and cons, and briefly outlined existing programs in the Chesapeake Bay region. As a continuation of her previous report, using data from NOAA and the Environmental Defense Fund, she graphed Virginia and Maryland fish landings for several species over a ten-to-twelve-year period. The data for these fish- striped bass, black sea bass, and summer flounder- shows numbers for fish landings both five-to-six years before a catch share program was implemented in each state for each species, and the five years following.
In her former piece, Libby stated that populations of striped bass in the Chesapeake had risen since catch share programs were implemented in Virginia and Maryland. Our first graph for striped bass landings in Virginia (1992 -2004) seems to correlate. Since catch share programs for striped bass were implemented in the Chesapeake region in 1998, both populations and fish landings (in metric tons) for striped bass have increased.
Catch sharing was implemented in Maryland for summer flounder in 2005. The immediate year after implementation, landings decreased, but for the next four years, landings followed an upward trend. It would seem that the catch share program has had a positive impact on harvests for the summer flounder.

Catch share programs do not seem to be having a positive effect on all Chesapeake finfish species, however – at least in terms of harvest numbers. Fish landings for black sea bass (1998-2010) decreased in both Virginia and Maryland after catch share programs were implemented in both states in 2004. It is difficult to tell if catch sharing has been a significant cause for this decline. Landings were decreasing prior to 2004, and continued to do so afterwards. It could be that a combination of factors contributed to a decline in black sea bass landings.


Catch Shares in the Chesapeake Bay and Beyond
By Libby Warner
On our visit to Antipoison Creek, we met with a fisherman who spoke somewhat highly of catch share programs. Afterwards, I investigated the purpose of catch share programs as well as the pros and cons of their implementation.
Catch share programs were originally developed in the United States to promote the economic and environmental stability of fisheries. In 1976, the federal government officially acknowledged that overfishing was a national issue and passed the Magnuson Steven’s Act. This created regional councils to manage fishing practices in different parts of the country. The act was first amended in 1996 with the Sustainable Fisheries Act. This amendment limited fisheries to only fishing during certain times of the year, a method referred to as derby fishing. Fishermen would fish as much as they could during the limited time frame, which resulted in increases in overfishing, illegal poaching, and competition and conflict between recreational and commercial fishermen. There were also several negative economic impacts associated with derby fishing. In 2006, the Magnuson Steven’s Act was amended with the Fishery Conservation and Management Reauthorization Act, which installed various catch share programs throughout the country.
In regions with catch share programs, including the Chesapeake Bay, a total maximum number of allowable catch is instated per annum for a particular species of fish. Individual fishermen and companies are then assigned a TAC, or total allowable catch, a quota based on the number of fish each company caught in the past. Many question the fairness of quotas decided in this fashion. However, the incentive of catch share programs is to limit the amount of fish caught overall rather than limiting the time of year fish can be caught.
In addition to limiting total catch, there are a number of benefits associated with catch share programs. For instance, since the implementation of catch share programs, the Chesapeake Bay, along with other bodies of water throughout the country, have seen a decrease in the number of discards and ghost fish, (fish that get caught in equipment and either die or are lost). There have also been improvements in fishermen safety. During the derby fishing days, fishing was one of the most dangerous jobs in the country. Due to time constraints, fishermen would rush out to catch fish despite poor weather conditions. With the removal of time constraints, catch share programs have provided more full-time jobs, rather than part-time jobs as fishermen now have a year-round season.
Another benefit of catch share fishing is that it increases the quality of fish caught. Since companies own portions of fish stock, they are often more invested in taking care of their stock. Being free to fish any time of year results in fishermen focusing on quality rather than quantity of fish caught. This is especially beneficial for the health of local people who rely on fish as a primary source of protein.
Whether or not catch share programs have actually made fishing more environmentally sustainable is still up for debate. Many argue that proof of success includes rebounds of fish populations across the country, including blue king crab, snow crab, Pacific coast widow rockfish, Atlantic windowpane flounder, and Gulf of Mexico red snapper. While the government has been able to increase total catch limits over time, showing proof of sustainability, many also argue that it is difficult to determine whether or not the rebounds in fish populations are a direct result of catch share programs. Many environmental activists are opposed to catch shares because it is essentially a privatization of public resources. Fishing companies are allowed to trade or sell quota, which results in armchair fishermen, (large fishing companies who sell quota to smaller companies and receive a portion of the profit). Large companies are now more capable of taking over the industry and owning most of the shares. Grassroots environmental activists use the phrase “corporate industrialization of fisheries” to describe the large fishing companies that are becoming monopolies in the fishing world. This is potentially problematic because large corporations in a capitalist society do not always rank environmental interests as a priority. Additionally, although catch share programs have resulted in a shift from part-time jobs to full-time jobs, overall, the monopoly aspect of catch shares has decreased the total number of jobs available.
Catch share programs approach conservation by focusing on individual species of fish rather than looking at aquatic ecosystems as a whole. Many environmental activists argue that the real issue is that, worldwide, there are currently approximately five times as many boats fishing as would be needed to catch a sustainable number of fish. With the implementation of catch share programs, fishermen often respond by simply moving to other parts of the world. Therefore, the total number of fish caught worldwide may not be reduced.
Catch shares are just as controversial in the Chesapeake Bay. Ten years ago, Virginia installed a catch share program in the Bay for striped bass, a population that had been overfished. After the catch share implementation, Virgina has been able to sustainably manage the striped bass population. To implement this program, NOAA provided educational sessions for striped bass fishermen to learn about catch shares and aided fishermen in the transition process from derby fishing to catch share fishing. From an original catch season of three months, the government extended the harvest period for striped bass to eleven months. The Virginia program has also allowed fisheries to be more economically successful.
Another positive result of catch share programs in Virginia is the development of “Chesapeake Catch.” Chesapeake Catch is a smartphone application developed for fishermen in the Bay, allowing them to log their catch and view data regarding other fish caught in the Bay. This has been a successful way for fishermen to come together and communicate within the industry.
Maryland took longer to implement the catch share program for striped bass; a total allowable catch was not instituted until 2014. Catch shares in both Maryland and Virginia have received criticism for putting small fishermen out of business. Throughout the Bay region, many fishermen, particularly smaller family businesses, complain that catch shares have changed their traditional fishing techniques, and allowed larger fishing corporations to control the small companies.
With striped bass being Maryland’s state fish and it’s third most valuable seafood industry, the catch share program implementation for striped bass in Maryland is very significant. Despite the complaints, since the program began, striped bass populations have improved and overfishing has declined in both Maryland and Virginia.
After exploring the different stances people take toward catch shares, and examining the pros and cons of this fishing technique, I have come to the conclusion that overfishing is an extremely complicated issue with no simple solution. It is still relatively unclear whether or not these programs are environmentally sustainable on a global scale. Catch share programs, however, seem to be effective in the Chesapeake Bay watershed. Although there are may be short-term economic downsides to catch shares, there have been ecological benefits in the Chesapeake region.
Sources:
https://www.edf.org/oceans/how-catch-shares-work-promising-solution
http://marinesciencetoday.com/2013/04/09/catch-shares-what-are-they-and-will-they-work/
https://www.youtube.com/watch?v=Sf5GlGDD40M
http://www.nmfs.noaa.gov/sfa/laws_policies/msa/
https://www.youtube.com/watch?v=oJzY5Ml1kd8https://mission-blue.org/2015/12/chesapeake-bay-suffers-from-menhaden-reduction-industry/
http://www.voanews.com/content/catch-shares-aim-sustainable-fishing/2902080.html
http://www.takepart.com/article/2013/03/18/us-fishing-rebound-it-over-small-fishermen
The Chesapeake Bay Stock Assessment Committee Releases Annual Advisory Report on Blue Crabs
We’ve seen reports that the blue crab population is up this season, and activity has certainly increased in Antipoison Creek compared to recent years. We have at least three crabbers with pots at the mouth of the creek, collecting bushels of crabs in the double digits many days. We’re about halfway through the crabbing season, which is when the Chesapeake Bay Stock Assessment Committee (CBSAC) releases their advisory report each summer on blue crabs. Made up of state agencies and scientists from Maryland and Virginia, the most recent publication, issued June 30, echoes other recent reports we’ve read about crab population abundance.
One thing the CBSAC highlights is the abundance of female crabs in the Bay (which gives an indication of how the overall population will look in the next year). The committee keeps track of population estimates for adult female crabs, juvenile crabs, and male crabs in the Bay. The committee also sets threshold limits and targets for adult female population numbers. The threshold limit, the point at which the adult female population should not fall below, is set at 70 million; the target is set at 215 million.
This year at the beginning of the harvest season, the committee counted an estimated 194 million spawning age female crabs, which is a 92% rise from last spring’s count. Because only 15% of adult females were harvested last year, which was below the 25.5% harvest target, and given that 194 million adult females is well above the 70 million threshold, the Stock Assessment Committee has declared that overfishing is not occurring in the Bay.
However, the count of adult females is still something to look out for, regardless of how well the population is doing this year, especially as the current season continues. The CBSAC points out that it was only two years ago when the adult female crab population dropped below the 70 million-threshold mark. Blue crab population numbers can be extremely variable, so a good harvest and population one year does not ensure healthy numbers for the next season.
The CBSAC report includes a list of recommendations to continue to support and increase the blue crab population, which includes expanding blue crab sanctuaries in Virginia (Lower Bay), Maryland (Upper Bay), and parts of the Potomac River (overseen by the Potomac River Fisheries Commission) to protect females of spawning age. The CBSAC also calls for improvements in surveys and data acquisition needed to make more informed estimates of current population numbers. One other recommendation made by the commission, dependent on further assessment, is instating an annual total allowable catch (TAC), which is a fisheries method we will go into more detail on here shortly.
You can check out the full CBSAC 2016 report here.
Grasses, Blue Crabs See Comeback
Surveys for both blue crabs and underwater seagrass found increases in population levels and acreage in the Chesapeake Bay this year.
The 2016 joint survey between the Maryland Department of Natural Resources and the Virginia Institute of Marine Science (VIMS) found that there are 35% more blue crabs in the Bay than this time last year. More specifically, the female population reached 194 million individuals, with overall numbers reaching 553 million.
Crab population numbers tend to fluctuate year-to-year, based on a number of factors, such as habitat loss, water temperatures, and harvest levels. The past two years have seen improvements to population numbers, but the blue crab is still considered to be in a state of recovery. Numbers have not reached 800 million, the number of blue crabs found after the first survey in 1988, in many years. With population fluctuation in mind, experts at the Smithsonian Environmental Research Center stated that this year’s good news does not necessarily mean that stricter harvest restrictions in Virginia and Maryland should be lifted. (SERC, 2016).
Crab population levels can be linked to seagrass acreage in the Bay. Seagrass provides habitat and protection for juvenile blue crabs. In past years, seagrass loss has been one predicted cause for blue crab population declines. The most recent survey from VIMS found that Bay seagrass acreage in 2015 was the highest it has been in 30 years. Perhaps these increases correlate to blue crab numbers.
The VIMS survey counted 91,631 acres of seagrass, up 21% from the 2014 survey, and 140% from the first survey in 1984. For more information on growth rates in specific regions (Upper Bay, Mid Bay, Lower Bay), please see the Bay Journal.
The Potomac Conservancy Releases Report Card for River’s Health
The Potomac Conservancy has released their biennial report on the Potomac River, the second largest river draining into the Chesapeake Bay. The health of the Potomac River, due to its large area and population size within watershed boundaries, is very important to the health of the Bay. The Potomac Conservancy has issued the River a grade of B- in terms of overall health. Rising from a D to a C to a B- over the past ten years, the state of the Potomac River is improving. However, a number of different areas need to be addressed to continue to improve water quality in the Potomac and the Chesapeake.
Figures 1, 2, and 3 show changes to nitrogen, phosphorus and sediment loads in the Potomac from 1985 to 2014. Over this time period, there have been load reductions from these three major sources of pollution.


The improvements in overall health of the Potomac River are due in large part to reduced sediment and nutrient loads from agricultural activity and wastewater treatment plants.
Wastewater treatment facilities have undergone a number of upgrades to ensure that water discharged from facilities contains smaller concentrations of nitrogen and phosphorus. With higher standards now required by the EPA, upgrades to many wastewater treatment facilities in the watershed have contributed to cleaner waters in the Potomac River. (Between 2011 and 2015, there was a 13% increase in facilities adhering to stricter EPA standards).
Agriculture in the Potomac River watershed has likely contributed fewer nutrient loads because agricultural activity within the region is declining, as land is converted to accommodate urban sprawl. The Potomac River, which flows from Fairfax Stone, West Virginia to Point Lookout, Maryland, covers a large urban and suburban area. So, while agricultural runoff is decreasing, nitrogen and phosphorus loads in stormwater runoff from developed areas is still a major concern.
Within this report, the Potomac Conservancy grades a number of sub-indicators of river health, such as fish population, underwater grass abundance, and recreational use. These ratings are then examined together to determine overall health. While overall health of the river is improving, there are some areas that are actually doing worse, or showing no marked improvement from previous years. This is the case for water clarity and underwater grass abundance, which received a grade of C-. These two factors are important indicators of health in the Chesapeake Bay (underwater grasses provide food and habitat for marine species, and filter sediments and nutrients in the water, which can improve water clarity). Going forward, I would definitely like to see higher rates of recovery for these two indicators.
There is mixed news for the river’s fish populations. Certain species, such as shad, white perch, and smallmouth bass are experiencing population growth. The Bay’s rockfish population, however, has declined slightly over the past ten years. Many fish species are at continued risk of predation from invasive species such as the blue catfish and snakehead.
In terms of tidal water quality, certain conditions are improving, although numbers for dissolved oxygen, clarity, and chlorophyll A (a measure of algae), vary year to year. Chlorophyll A levels have declined over the last fourteen years. See Figure 4 below.
[We have been taking water samples from both the Potomac River (out of Great Falls), and Antipoison Creek, (which is just off of the Chesapeake Bay, close to where the Rappahannock River meets the Bay), and interestingly, found higher chlorophyll levels in Antipoison Creek. I’ll post more on our results later.]

There was good news for recreational land use, which has gone up since the last report. Recreational use of waterways can be an indicator of improved water quality.
Protected land area has increased, from 1.8 million acres in 2011 to 1.9 million acres in 2013. This area equates to 26.6 percent of land in the Potomac River watershed.
Concerns going forward include rates of deforestation and development in unsuitable areas, and runoff from suburban and urban regions. Agricultural areas, while declining, could still do with the enforcement of Best Management Practices (BMPs). The amount of forested buffers (streamside vegetation which reduces agricultural runoff into tributaries), received a grade of C-.
It’s important to keep in mind that the results in this report do not come from the most current data. The Potomac Conservancy gathers its information from a number of institutions, such as the EPA and the USGS. There is a couple years lag time on data for many of these sub-indicators of overall health.
Information and graph source: State of the Nation’s River 2016, Potomac River Conservancy, http://potomacreportcard.org.
Phosphorus Levels on Maryland Farmland Lower Than Expected, Still a Significant Risk to Bay Water Quality
The Maryland Department of Agriculture (MDA) released a report earlier this month on soil phosphorus levels on state farmland from the second half of 2015. The MDA found that 18% of Maryland’s farmland has soils oversaturated with phosphorus. While this percentage is not as high as was expected,** this is still a significant amount of state land contributing to phosphorus pollution in local waters- this is one out of every five acres of farmland statewide; and two out of three acres on the Eastern Shore, according to the Bay Journal (Wheeler, 2016).
Phosphorus pollution from agricultural fields is a major issue in Maryland, given the high number of poultry farms and poultry manure that is applied as fertilizer to nearby fields. When over-applied to farmland, fertilizer high in phosphorous (which poultry manure is), runs off into local waterways, and pollutes the Chesapeake Bay watershed.
Last year’s update to the Phosphorus Management Tool (PMT), and the 2016 Poultry Litter Management Act, which has yet to be voted on in the state General Assembly, are Maryland’s regulatory attempts to solve this pollution issue. These regulations would transport phosphorus-laden fertilizer to farmland elsewhere in the state where phosphorus levels are low. The MDA report stated that 82% of farm fields have lower phosphorus levels, excluding these fields from the PMT regulation- meaning these farms will be allowed to continue to apply fertilizer as usual.
The 18% of fields found to have oversaturated soils (high in phosphorus) will be subject to PMT regulations. This targets farmland on the Eastern Shore- two thirds of farmland on the Eastern Shore will be subject to PMT restrictions- and the Lower Eastern Shore in particular, where 11% of farmland is subject to restrictions on phosphorus fertilizers altogether (Maryland Department of Agriculture, 2016).
**Keep in mind that the report gets its data from samples taken on state farmlands, and data is incomplete. The document does not account for 30% of state soils due to a lack of reporting. Half of missing data comes from the Eastern Shore- the portion of Maryland where poultry production is highest, and soil phosphorus levels are of the biggest concern.
Poultry Litter Management Act Heard in Maryland House and Senate
The Poultry Litter Management Act, which shifts the burden of storage and transport of poultry manure from contract growers to the chicken industry (companies like Purdue, and Tyson Foods), was heard in the Maryland House and Senate this week. Senate Bill 496 was heard Tuesday afternoon (2/23), and House Bill 599 was heard on Wednesday (2/24).
In addition to shifting the responsibility of manure storage and transport from farmer to the poultry industry, these companies must work with their contract farmers to create nutrient management plans, to determine how much manure may be kept on surrounding agricultural fields as fertilizer. These nutrient management plans are to be completed before a contract grower is provided poultry.
If a farmer has too much manure, the poultry company (referred to as the integrator in the Bills) must ensure the contract grower is able to properly store the manure, until the manure can be transported to an appropriate location. Transport will be paid for by the poultry company, and not by the farmer or by taxpayer dollars (as transport is currently subsidized in part by the state of Maryland).
While the Act will shift burden of responsibility away from individual growers, there has been some backlash from agricultural groups in Maryland. A major complaint is that the Act gives poultry companies expanded powers over independent farmers, and takes away a farmer’s right to sell excess manure as fertilizer. Some fear that taking away the loss of the current cost-share system of poultry transport will create financial losses for contract growers.
Benefits, however, include expected improvements to water quality in the Chesapeake Bay. Over-application of manure in Maryland, and particularly on the Eastern Shore, results in tons of phosphorus runoff polluting local tributaries, and the greater estuary. Ensuring poultry manure transport to areas where fields are not inundated with phosphorus should reduce runoff and pollution issues in Maryland and in the overall watershed.
The Act is set to be implemented in October 2016, dependent on its passing in the House and Senate. While the Bills were heard, the Act has yet to be voted on. Updates to follow.
Maryland Introduces Poultry Litter Management Act, Shifting Burden of Manure Removal from Chicken Farmers to Big Ag
Last year, there was a lot of legislative turmoil surrounding the application of poultry manure on Maryland farmlands. Large-scale production of poultry is prevalent in Maryland, and on the Eastern Shore especially. Poultry manure is usually distributed on adjacent or nearby agricultural fields, which don’t necessarily need the excess fertilizer. Manure, high in phosphorus, therefore runs off into the Chesapeake Bay, contributing to nutrient pollution in the estuary.
While big companies such as Purdue supply many of the chicken farms in Maryland, it has been left to the individual farmers to deal with manure, and any of the associated costs of removal of excess manure. This is about to change. Maryland legislators introduced the Poultry Litter Management Act earlier this week. This Act aims to place the financial burden of excess manure removal in the hands of the big companies, such as Perdue.
According to the Baltimore Sun, poultry farms produce about 228,000 tons of manure per year that must be removed from agricultural lands. With last year’s updates to the Phosphorus Management Tool, further restrictions on amounts of manure that can be applied to fields are being phased in, and will increase the tonnage of excess manure that has to be removed.
Requiring the large companies to pay for removal will help the often financially-struggling chicken farmers, and the Maryland taxpayers that have been contributing to removal costs (as some of these costs are subsidized by the state). While poultry companies collectively rake in about a billion dollars each year, the new Act will only require the industry to spend about four million dollars per year.
Maryland Lawn Fertilizer Law
Last week, I saw several Chesapeake Bay news stories referencing a Maryland Lawn Fertilizer Law. There has been a lot of discussion in recent months about agricultural application of fertilizer, and the harmful effects nutrient farm runoff has on the Chesapeake Bay Watershed. Fertilizer is also frequently applied in nonagricultural settings, (with lawn fertilizer accounting for 44% of all fertilizer sold in Maryland), and can have just as harmful an impact on the Bay (but at a smaller scale).
I took a look into the Maryland Lawn Fertilizer Law, which went into effect in 2013. This law creates limits and restrictions for lawn fertilizer application across the state, in an attempt to reduce nitrogen and phosphorus runoff into the Bay Watershed. Before 2013, there were no Maryland state laws aimed at homeowners, and other non-agricultural consumers of fertilizer. Restrictions of fertilizer use for farmers has been in place since 2001. The Maryland Lawn Fertilizer Law targets fertilizer use by not only urban and suburban homeowners, but also owners of golf courses, parks and athletic fields, and businesses.
While the law does not forbid home and business owners from applying any fertilizer, it limits what can be laid down – limits that are created based on what is strictly necessary (and determined by the University of Maryland). Excess fertilizer results in stormwater runoff, depositing phosphorus and nitrogen into the Bay watershed, which is already heavily polluted with these nutrients.
This state law overrules any preexisting county legislation in Maryland that applied to nonagricultural fertilizer use.
Restrictions include:
-Lawn fertilizers with phosphorus (unless a soil test is taken, and shows that a particular lawn is in need of phosphorus)
-Lawn fertilizers with less than 20% nitrogen that is slow release
-The application of more than 0.9 pounds of total nitrogen per 1,000 square feet
-The hiring of lawn care professionals not certified by the Maryland Department of Agriculture (penalties apply: $1000 for the first violation, $2000 for every violation after that)
-The application of lawn fertilizers during “blackout dates” (November 15 – March 1)
-The application of lawn fertilizers to any impervious surfaces
-The application of lawn fertilizers before heavy rain forecasts
-The application of lawn fertilizers within 15 feet of waterways
