Bottom-Line on Net Metering
Here at beyondthebayblog, we’ve switched some of our focus to environment and energy issues in the region. Gary has been looking into the regional utility system, and examining some of the challenges associated with switching to more renewable energy. Specifically, he’s tackling the issue of net metering.
As property owners in Virginia decide to install and utilize small-scale solar panels while remaining connected to the grid, they must participate in net metering. The grid stores excess solar power generated by a consumer, and allows the consumer to buy electricity from the grid when they either can’t generate enough solar power, or are unable to generate any solar (such as at nighttime). Without storage solutions (reliable batteries are still very expensive), and without living entirely off-grid, consumers with solar power must participate in net metering. As you can guess, net metering tends to favor the consumer with solar, as his or her electricity bills generally decline in monthly cost. Utility companies tend to view this as a threat, and as such, certain companies such as Dominion Energy here in Virginia, place a cap on how much solar can be generated within the state. (Rooftop solar is currently capped at 1% of Dominion’s generating capacity). Gary has gone a little more in-depth, to examine the pros and cons of net metering, in his document “Bottom-line on Net Metering.” Please take a look. netMeteringDefense=v2
Greenhouse Gas Inventory in Fairfax County, Virginia
In June, Virginia’s Governor McAuliffe pledged to uphold the Paris Climate Agreement goals, agreeing to honor the state’s commitment to greenhouse gas reductions of 26-28% of 2005 levels by 2025. Since this time, I’ve been looking into how the state and its counties have addressed climate change mitigation in the past, and I have been researching ways in which we can move forward on 2025 goals. Much remains to be done at the state level, but I wanted to focus on Fairfax County for the time being. Fairfax is the county in which I reside. It is also the most populous county in Virginia. Action taken here to curb greenhouse gas emissions would go a long way in helping the state achieve its 2025 goals.
I started with searching for a greenhouse gas emissions inventory for the county, and found a report that spanned 2006-2010. Borrowing methods from the county inventory, I did a basic update for 2010 to 2015, looking at vehicles and stationary sources (consumption of electricity and natural gas). This inventory as of now does not go as in-depth as the 2010 county report, but it shows the biggest sectors contributing to greenhouse gas emissions in Fairfax.
I am including a chart below, which shows annual emissions from 2005 to 2010 (all emissions have been converted to metric tons of carbon dioxide equivalent or CO2e). Emissions from certain sectors have remained consistently high – vehicles, for instance, while others have fallen. Emissions from electricity consumption have significantly dropped over the past decade, contributing to the overall drop in greenhouse gases emitted from Fairfax County. This is likely due to the shift from coal-fired to natural gas fired power plants that took place over this time frame. Burning natural gas does not produce as much carbon dioxide as burning coal. Technology leading to “cleaner” burning coal may have helped as well. Despite this drop in emissions, over the past couple of years, progress has stalled. Fairfax County is about halfway to its 2025 goals, but the county has a long way to go, in terms of evaluating where new regulations should be put into place, and what changes can be made.
In addition to the individual emission sources, I have charted total emissions against the 2025 goal to demonstrate how much further emissions need to drop for the county to meet reductions pledged in the Paris Climate Agreement. I am finishing up a first draft of a report, and will share the inventory with the blog in the near future. Stay tuned!

Dolphin Sightings in the Bay
Researchers at the University of Maryland’s Center for Environmental Science (UMCES) are trying to keep track of dolphin sightings in the Chesapeake Bay. Both WTOP and the Star Democrat recently reported on the increases in dolphin sightings in the Bay over the summer months in recent years. UMCES now has an interactive map, which a user can add his or her own sightings to. After registering, users can click a location on the map, add the time and date of the sighting, and how many dolphins were spotted.
Funnily enough, I read both of these articles this morning, after spotting a dolphin in Antipoison Creek yesterday morning (7/5). I’ve gone ahead and added my own sighting to the map. Please do the same if you have seen any dolphins in the Bay or one of its tributaries. Doing so allows UMCES researchers to get a better idea of where dolphins are travelling, how often, and why sightings have increased in recent years. You can check out or add to the map here.
Mixed News from Blue Crab Survey

Each year the Maryland Department of Natural Resources, in partnership with UMCES and VIMS, conducts a winter dredge survey to estimate blue crab population numbers in the Chesapeake Bay. The survey gathers information on the total number of crabs, as well as the number of adult males, female crabs of spawning age, and juveniles. Total numbers give an indication of the current health of the blue crab population; the number of juvenile and female crabs of spawning age give an indication of future conditions. Spawning age females impact the beginning of the coming harvest season (April to July, now ongoing); juvenile crabs impact the harvest further down the line.
The 2017 survey brought mixed results. Total population decreased in number from last year’s 553 million count to 455 million.
Population numbers of spawning age females must meet a certain threshold to be considered sustainable (70 million). Virginia and Maryland have also adopted a population target of 215 million. This year’s count of females of spawning age was the highest since the survey was first undertaken in 1988, with a number of 254 million, well above the target number. This number increased from last year’s count of 194 million.
Survey results were not so good for adult males – which decreased by 16% – nor for juveniles. The number of juvenile crabs estimated in this year’s dredge survey was the fourth lowest number ever recorded. This decrease could impact the second half of this year’s harvest (Maryland’s crabbing season runs until December 15; Virginia’s season closes November 30). Scientists on the Chesapeake Bay Stock Assessment Committee are likely to release updated management recommendations to Maryland and Virginia later this summer.
Note: To read more about where the winter dredge survey takes place, and how the survey is conducted, please read this piece from Maryland’s Department of Natural Resources.
Sources: WVTF Public Radio, Maryland DNR
Climate Change in Delaware Bay
Ted Williams wrote a piece this week for Yale Environment 360 on the impact climate change is having on the Delaware Bay. Although this estuary is much smaller than the Chesapeake Bay (782 square miles to the Chesapeake’s 64,299 square miles), the two watersheds have a lot in common, in terms of geographic location, features, and marine and shorebird species. The changes Williams sees occurring in Delaware Bay are either issues we are currently seeing in the Chesapeake, or could be a sign of changes to come.
The most dramatic change occurring in the Delaware Bay is the loss of tidal wetlands due to sea level rise and erosion. The watershed is losing an acre a day of its wetlands. With rate loss expected to increase, by 2100, 90% of these wetlands may be lost.
Wetland loss impacts lifecycle processes of several species. Atlantic menhaden larvae require tidal marshes. Ribbed mussels (an important filter feeder in the Bay) form tight-knit clusters in marshes; erosion makes the mussels more susceptible to predation.
Sea level rise contributes to beach erosion and shoreline tree loss. Horseshoe crabs, which use beaches in the Delaware Bay watershed as spawning grounds, are losing their grounds to sea level rise. Some shorebird species dependent on horseshoe crab eggs, such as the red knot, are at risk from these environmental changes.
Certain species in the Delaware Bay may see short-term benefits from climate change. With fewer freezes occurring, Delaware Bay oysters can survive in intertidal zones. However these now warmer zones are hosts to diseases (MSX and Dermo) and predators (oyster drills).
Warmer waters exacerbate pollution issues. Nutrients build up, dissolved oxygen can decrease, and algal blooms can increase in frequency.
The Chesapeake Bay is also experiencing shoreline loss and erosion. Places like Dameron Marsh and Hughlett Point in Virginia have been discussed here previously in terms of erosion and sea level rise. Naturally warmer waters in the Bay mean that diseases such as MSX and Dermo have been impacting native oysters for decades. It will be interesting to see how warmer waters -associated with climate change- host new or increased populations of pests/predators for our oysters. Ocean acidification may also be a concern. The changes occurring between species relationships, such as between Delaware’s red knot and horseshoe crab, will certainly be something to look out for in this watershed.
To read Ted Williams’ article, please visit e360.yale.edu.
Microplastics in Antipoison Creek
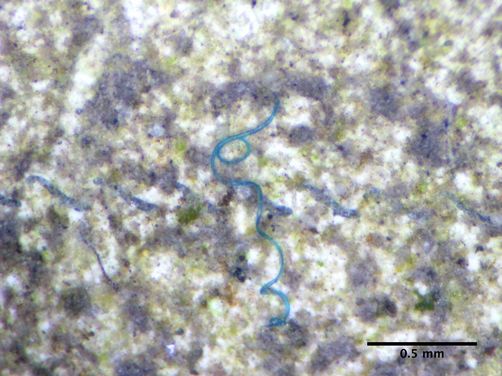
If you remember, last December G2 sent in water samples from Antipoison Creek to Abby Barrows at Adventure Scientists (see this former post). Abby has been documenting the presence of microplastics in global waters. Microplastics are bits of microscopic plastic debris. A major source of this debris is clothing. As synthetic fibers (many clothing items such as fleeces are made with synthetic fibers) are put through the washing machine, plastic debris from these items come out of homes as wastewater, and eventually make their way to streams, rivers and oceans. Preliminary evidence suggests that marine species are reacting negatively to the ingestion of microplastics. The team at Adventure Scientists has been accepting water samples from around the globe to determine how prevalent pollution from microplastics is. You can check out their online map to see which waters have not been sampled yet, and sign up to sample if you see an opportunity to contribute.
G2 received results from the Antipoison Creek samples. One blue microfiber was found from our samples. The results were shared via the Adventure Scientists blog here, which also includes a post on Abby’s lab process and overall project results thus far. Go check it out!
Chesapeake Bay Report Card Released
The University of Maryland’s Center for Environmental Science (UMCES) has issued their annual report card on the health of the Chesapeake Bay watershed for 2016. This report examines several factors, including water quality, fisheries, and vegetative growth. Contributing factors are examined individually and the Bay is given an overall score based on these factors. This year, UMCES awarded the Bay watershed a C grade for the 2016-reporting year. While the letter grade remains unchanged from former years (going back to 2012), Bay health has improved by 1% since 2015- up to 54%.
This year’s online report is somewhat more interactive than in previous years, and includes some great graphics and graphs comparing Bay health indicators over time. I encourage readers to check out the report themselves here, however, to sum up these individual indicators:
- Overall health improved in certain segments of the Bay, most noticeably in the Lower Bay (adjacent to Virginia’s Middle Peninsula and Virginia Peninsula on the Western shore).
- Dissolved oxygen levels remained at relatively good levels throughout 2016. Dissolved oxygen levels are a major concern in the mainstem of the Bay during the summer months, when water temperatures rise, water is still/stagnant reducing the mixing of fresh and saltwater, and nutrient pollution contributes to algal blooms. These factors reduce oxygen levels needed by marine species.
- Total nitrogen decreased slightly from 2015. The best results were seen in the Lower Bay (which scored highest for overall health), and in the James and Rappahannock Rivers (which feed directly into the Lower Bay). Total nitrogen levels were highest in portions of the Bay adjacent to the Lower Eastern Shore and in the Upper Bay. Higher nutrient levels seem to correlate with the location of big agricultural regions. Agricultural runoff from poultry farms on the Eastern Shore and from the ag-rich northern reaches of the watershed in Pennsylvania and Maryland are likely major contributors to these higher nitrogen levels. The Potomac River also scored poorly for total nitrogen, likely due to a mix of agricultural runoff and urban/stormwater runoff.
- Total phosphorus levels were good overall. The mainstem of the Bay scored the highest, while certain tributaries -the James and York Rivers – had poor scores.
- Chlorophyll a levels were poor throughout the Bay, scoring a D in all but the Upper Bay and Lower Eastern Shore (C), and the James River (B). UMCES attributes high chlorophyll a levels to elevated nutrient availability.
- Water clarity overall was poor or very poor throughout the Bay. The only exception was the highest rated Middle Bay, which received a C score.
- Aquatic grass abundance continues to be an issue in the Bay. Overall, acreage of submerged aquatic vegetation has steadily declined since the mid-to-late twentieth century. Certain areas have seen improvements since 2012. The Rappahannock River, Lower Eastern Shore and Upper Bay scored the highest for aquatic grasses, with a B grade. I cannot comment on the other portions of the Bay, but the Rappahannock River ranking is consistent with what we have been observing where we take water samples – in Virginia’s Antipoison Creek and Little Bay – where we saw Bay grasses return last spring. These grass beds show signs of returning this year.
- The benthic community refers to bottom-dwelling and filter-feeding organisms. In the Chesapeake Bay, the benthic community includes (but is not limited to) bacteria, worms, clams and oysters. I believe the oysters scored in this report refer only to native oyster populations. Overall, the benthic community had a decreased score from the previous two years. All but the Lower Eastern Shore (B) and the Lower Bay (A) scored low. The Middle Bay and Potomac River had very poor scores. The benthic community is impacted by nutrient, sediment and dissolved oxygen levels. The community fared best where both total nitrogen and dissolved oxygen levels also scored well (the Lower Bay).
- Blue crabs scored very well throughout the Bay (A), relating back to 2016 survey results.
- Bay anchovy and striped bass also scored an A throughout the entire Bay. Conditions for these indicators have been consistent since 2012.
Conditions in the Lower Bay are consistent with what we have been seeing at Antiposion Creek (at the very tip of the Northern Neck where the Rapphannock River meets the Bay; the Rapphannock River is the dividing line between the Northern Neck and Virginia’s Middle Peninsula)- aquatic grasses are returning; the crab population was abundant last summer, according to local watermen; our nutrient levels coming back in our sample analysis show a generally healthy watershed.
Agriculture is still a major land use in the Lower Bay watershed. However, it would be interesting to study how land use in the Lower Bay has changed from agricultural or commercial waterfront operations to residential, compared to the agricultural areas in the Upper Bay and Eastern Shore, where overall health was poorer. Perhaps this land use change, if the difference is significant enough between the Upper and Lower Bay watershed, is influencing health indicators. The Lower Bay has also seen an influx of commercial and recreational oyster production in its waters (something that has not been adopted to the same extent in Maryland). This too is likely impacting nutrient levels in the Lower Bay.
Proposed Federal Budget Cuts Threaten Chesapeake Bay Restoration
The Office of Management and Budget recently released proposed budget cuts to certain federal agencies for Fiscal Year 2018. Among these proposed cuts is a $68 million reduction in funding for the Chesapeake Bay Program (CBP), an EPA program office that partners with Bay states and agencies to restore and protect the Chesapeake Bay.
The CBP oversees the Bay Watershed Agreement, and works with states to meet watershed cleanup goals laid out in this agreement by 2025. To meet 2025 goals, the CBP has been creating two-year work plans since the agreement was signed in 2014. These plans lay out specific objectives for fish and shellfish species, wetland and stream restoration, and submerged aquatic vegetation acreage; the plans address issues such as climate change, land use, and pollution.
Should the EPA have to cut funding for the Chesapeake Bay Program from $73 million to $5 million, Bay restoration will be largely left to the states (VA, MD, WV, PA, DE, NY and the District of Columbia). With eight years left in the Watershed Agreement **, and while the Bay still only meets a grade of C- (Chesapeake Bay Foundation, “State of the Bay,” 2016), reductions in federal funding would risk state and District programs aimed at Bay restoration and conservation, and could setback achievements made under the Watershed Agreement thus far.
** The Watershed Agreement lays out watershed cleanup goals until 2025. I would like to stress that goals may not be met by 2025, and even after this date, watershed protection programs must be left in place in order to preserve any cleanup goals made.
Marching for the Environment


This past Saturday, I joined the Women’s March in Washington, D.C. While I marched for a number of social justice issues, one of my primary concerns in today’s world is climate change, and the preservation of the scientific community. Since this is a blog dedicated to the Chesapeake Bay, I would like to remind readers of the threats climate change pose to the Bay and the greater watershed.
Sea Level Rise:
Sea level rise is one of the most well known impacts associated with climate change. The most recent projection from climate scientists (March 2016), foresee global waters rising by two meters, or over six feet, by 2100. Sea level rise is already having severe impacts in the region, particularly on Smith and Tangier Islands in the Chesapeake. I visited both islands in 2011, and saw – more noticeably on Smith Island- major portions of the island inundated with water. Although sea barriers can delay impacts, waters are rising on the islands by about 2 feet each year. It is estimated that Smith Island will be completely underwater by the end of the century.
Sea level rise is especially potent in this region due to the natural sinking of land at the southernmost part of the Chesapeake Bay watershed. We’re seeing the biggest impact on our islands, but coastal towns and cities are facing sea level rise as well. Because of climate change and land subsidence, the Hampton Roads area for instance, is “experiencing the highest rates of sea level rise along the entire U.S. East Coast,” (WRI, 2014).
Coastal Flooding & Shoreline Erosion:
Related to sea level rise are the issues of coastal flooding and shoreline erosion. Sea level rise contributes to shoreline erosion and leads to an increase in flooding incidents. Cities in Southeast Virginia will be especially vulnerable to increased coastal flooding events (VIMS, 2012). Cities further north in the watershed are seeing a rise in coastal flooding events too. Annapolis reports that floods occur ten times as often as they did in the 1950s (CBP, 2016).
Miles of coastline along the southern Chesapeake region have been eroded; sea level rise may be playing a part (see former post here on Dameron Marsh and Hughlett Point).
Acidifying Waters:
Ocean acidification is the acidifying of marine waters as the ocean absorbs carbon dioxide (CO2) from the atmosphere. It is unclear how much of the Bay watershed will be impacted by acidification, however acidification could impact several species in the Bay. Shellfish make their shells out of calcium carbonate. As waters absorb CO2, and water chemistries change, certain shellfish face difficulties building their shell. This is true for the Eastern oyster found in the Chesapeake Bay, whose shells would become more brittle in acidified waters, and leave them more vulnerable to other threats.
Oysters are making a major comeback in Virginia, but the oyster farms and the restaurants that have emerged around this industry in recent years would face the biggest economic losses if and when Bay waters become more acidic.
Scientists are still studying how ocean acidification will impact the blue crab population in the bay (studies are being undertaken at institutions like UMCES). Crabs form their shells differently than oysters, and acidification may actually strengthen the shells of blue crabs. However, a researcher at UMCES has found that juvenile crabs grow more slowly in acidic waters. Given that juvenile crabs are threatened by other environmental issues in the Bay- such as the loss of seagrass habitat- ocean acidification could play a part in reducing blue crab population numbers.
Warming Waters:
Temperatures of regional bodies of water have been rising in correlation with rising air temperatures. Over the past 50 years, stream temperatures in all six Bay states (NY, WV, DE, MD, PA and VA) and in Washington, D.C. have risen by an average of 1.2 degrees F and up to 2.2 degrees F (CBP, 2016; EPA, 2016). This may not seem like a major increase to us, but it can be to marine species. Warming waters – even seemingly small increases in temperature- can contribute to dead zones and algal blooms. Cold-water fish species are more likely to be displaced by fish that thrive in warmer waters. Warmer waters can also impact fish and plant growth and reproduction.
Scientific studies – including data collection and modeling- play a crucial role in understanding how our climate is changing, and how our environment and wildlife will respond to these changes, both in the Chesapeake Bay watershed and beyond. We must continue to support the collection of data and dissemination of scientific reports on our environment.
Virginia House and Senate Bills Target Pollution from City of Alexandria’s Combined Sewer System
Late last month I put together a list of environmental bills that were going to come up in the Virginia General Assembly for the 2017 session. I would like to go into more detail on the bills related to Alexandria’s combined sewer system, and provide you with some updates on those bills.
The City of Alexandria has an outdated wastewater management system. Their combined sewer system, which collects both wastewater and stormwater for treatment at Alexandria Renew, is prone to overflow events during periods of heavy rainfall. Overflows discharge millions of gallons of raw sewage into the Potomac River- up to 70 million gallons per year, according to the Potomac Riverkeepers. Raw sewage discharged into the Potomac River negatively impacts water quality and wildlife; causes major public health risks; and exacerbates nutrient pollution in the Chesapeake Bay- a watershed that the state of Virginia has pledged to clean up, through the EPA-mandated Chesapeake Clean Water Blueprint.
Two of the original bills in the 2017 legislative session -House Bill 1423 and Senate Bill 819- targeted discharges from the City of Alexandria’s combined sewer overflow (CSO) system.
House Bill 1423, was first referred to the Committee on Commerce and Labor, has since been referred to the Committee on Agriculture, Chesapeake, and Natural Resources (on 1/19). This bill calls for the Department of Environmental Quality to identify CSO outfalls that discharge into the Potomac River and lay out actions to bring these outfalls into compliance with federal and state laws by July 1, 2027. This bill would directly target Alexandria’s CSO Outfall Site 001.
Senate Bill (SB) 819, introduced by Senator Adam Ebbin (who represents part of Alexandria) called for the City to complete an assessment of needed system improvements and discharges from Alexandria Renew’s outfall sites to the Potomac River watershed by January 1, 2029. Failure to do so would cause the State Water Control Board to hold off on renewing the Virginia Pollutant Discharge Elimination System permit for this wastewater facility. This bill was stricken from the docket of the Committee on Agriculture, Conservation, and Natural Resources on January 12, before it could reach the Senate floor.
Senate Bill 819 seems to have been scrapped in favor of stronger regulation. On January 12, the same committee that killed SB 819 introduced a new bill, which would require the City of Alexandria to eliminate all discharges of sewer into the Potomac River watershed by July 1, 2020, with severe financial penalties enacted for failure to comply. The committee ultimately adopted a substitute (on 1/19) to bring to the Senate floor, lengthening this timeline to 2025.
The City of Alexandria needs to update and reconfigure its combined sewer system to eliminate overflow events, and it needs to do so sooner than the timelines laid out in the recent House and Senate bills if Alexandria is serious about improving water quality and decreasing public health risks. The City of Alexandria released their Long Term Control Plan Update late last year which lays out how they will deal with this issue, but the timeline for this plan is also too long. Many of the proposed fixes would not be fully implemented for at least another 15 years. The DEQ still needs to approve this plan and the City must finalize funding. The Long Term Control Plan Update is several steps away from being put into motion.
The first wastewater treatment facility in the City of Alexandria was constructed in 1956; a combined sewer system existed long before that. This discharge issue is one that has been occurring for decades. It is time to eliminate all discharges of raw sewage to the Potomac River.
