Month: May 2016
My Experience at UMCES: Chesapeake Biological Laboratory
By Libby Warner
The University of Maryland Center for Environmental Science’s (UMCES) Chesapeake Biological Laboratory (CBL) on Solomon’s Island is a research facility where scientists study various aspects of ecosystems, including restoration ecology, toxicology, and fisheries. On Monday, May 16th, I had the opportunity to visit the center and learn about the different projects taking place on a very informative and inspiring tour given by the CBL Director, Dr. Thomas Miller. Upon arrival, I immediately was struck with the beauty of the location. Red brick buildings with many windows overlook the Patuxent River, which feeds into the Chesapeake Bay. There is a grand, gated-off research pier that extends out into the river and contains a Pump House, which transfers water to various laboratories for testing.
The first stop we made on our tour was the Nutrient Analytical Services Laboratory that tests water quality. This laboratory consists of approximately seven full time scientists whose job is to run water samples through extensive tests that indicate the levels of various chemicals such as phosphorus or nitrogen. These samples can come from a variety of places, ranging from creeks to oceans, and therefore the analysis of these water samples varies. There are two primary methods used for these chemical tests. One method involves a spectrophotometer that relies on robotics and allows very small water samples to be used. The other method is less advanced and has existed since the 1970’s. It involves a complex tubing mechanism that relies on a very specific air pressure system with air bubbles existing every few centimeters in the tubes. This method requires larger water samples, but is beneficial in that it helps the operator gain a better understanding of how the system works. In some instances, it also gives a more accurate reading than the robotics system.
The next stop we made was in the “crabs on acid” laboratory. This lab is used for research on the effects of ocean acidification on blue crab populations in the Chesapeake Bay. A PhD candidate, Hillary Glandon, conducts this research. There are a few large tanks hooked up to the piping system, which collects water from the Patuxent River. The piping system has two pipes, which are alternatingly utilized to prevent the buildup of sediment and barnacles. The large tanks of river water in the laboratory act as different treatment groups, each with a different pH, which is controlled by adding different amounts of CO2. Each large tank feeds into multiple smaller tanks, which host the blue crabs. Originally, the proposed thesis was to determine the effect of ocean acidification on crab shell growth. However, with blue crab shells being difficult to measure due to the molting process that they undergo, Hillary altered her experimental question and is now studying the effect of acidification on blue crab respiration rates. (Lab pictured below).
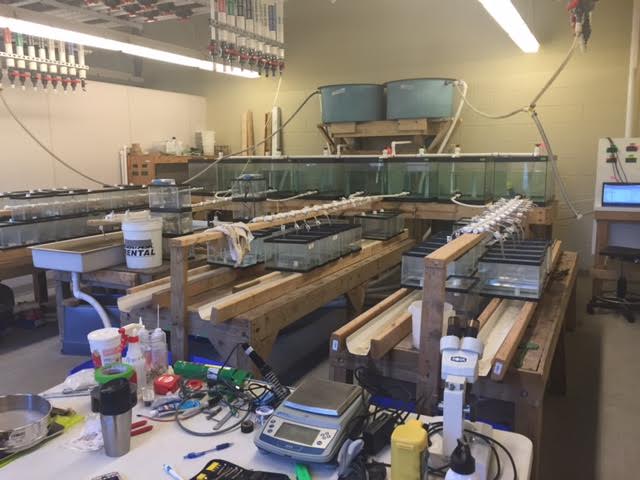
After our stop at the blue crab laboratory, we went to a laboratory that measures methane levels in samples of water from the tropics. Another UMCES graduate student pursuing her PhD, Hadley McIntosh, conducts this research. These specific laboratories were a few of the many sites of research at UMCES. There are approximately 20 graduate students currently attending the university in addition to at least a dozen other full time employees who help provide nutrient analytical services. An interesting statistic regarding this gradate program is that about 65% of the students are women.
Overall, this visit inspired me, not only as a science student, but also as a member of the millennial generation. We are a generation of rising world leaders and it will be our responsibility to restore our planet’s environment after the damage it has received from prior generations. Research facilities such as this one on Solomon’s Island give me hope that, with the existence of strong, innovative scientific communities such as this one, we may have a shot at a brighter future.
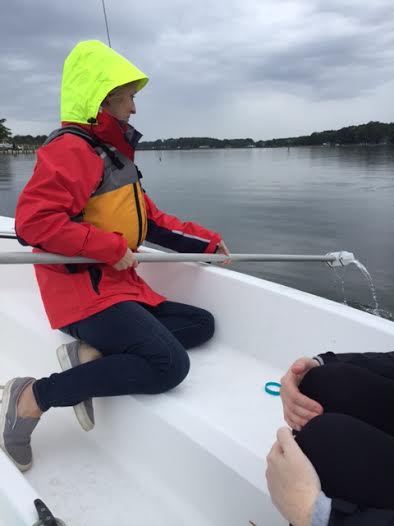
The author, Libby Warner, our new contributor to the blog, pictured below, collecting water samples on the Chesapeake Bay:
Water Quality Testing Data on Potomac River, Antipoison Creek
We’ve been working with the Nutrient Analytical Services Laboratory (NASL) at the University of Maryland Center for Environmental Science’s Chesapeake Bay Laboratory for several months now, analyzing water quality in the Potomac River and Antipoison Creek (a small tributary of the Chesapeake Bay on Virginia’s Northern Neck). NASL provides the analytical services for phosphates, nitrates, ammonium, and various forms of chlorophyll (total, active, and phaeophtin), from water samples that we collect, and filter in preparation for analysis. We also measure pH and salinity of these samples. For more on procedures, please see my previous post here.
The sampling sites on the Potomac River are found just north of Riverbend Park’s visitor center. Samples here are collected on foot, with a swing sampler, at three locations (with two samples taken per location, samples “A” and “B” in the data shown below). The Antipoison Creek samples are taken via boat at five or six locations(also with two samples taken per location). Sampling is generally conducted once a month on both bodies of water, or after an extreme precipitation event. Sampling began on Antipoison Creek this past September, and on the Potomac River this past January.
Now that we have a few months of data, we would like to share them here.
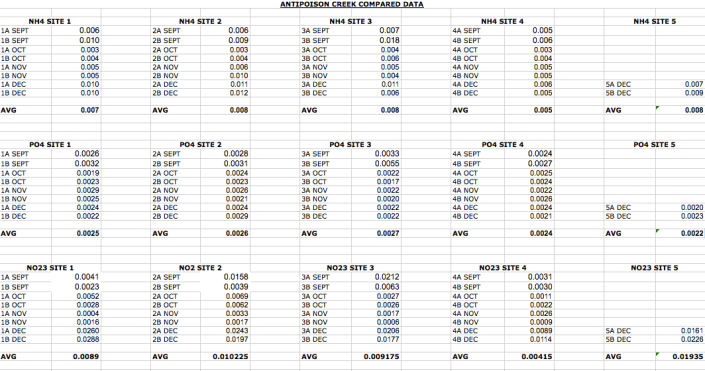
The following is ammonium (NH4), phosphate (PO4), and nitrate (NO23) levels, and their averages, at Antipoison Creek from September to December of 2015. We did not start testing for chlorophyll until December of 2015, and only have one month’s worth of data for those parameters.
The following is ammonium (NH4), phosphate (PO4), and nitrate (NO23) levels, and their averages, on the Potomac River from January and February from this year.
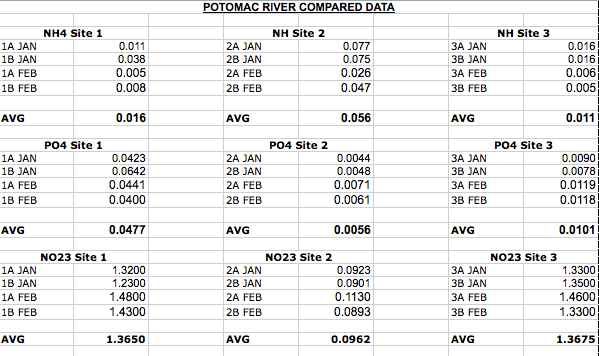
Comparing between sampling locations, ammonium, phosphate and nitrate averages from the Potomac River samples are significantly higher than the Antipoison Creek samples. The Antipoison Creek watershed is rural. There is some agriculture going on in the fields surrounding the creek, along with low-density residential development. Antipoison has a great deal of oyster aquaculture taking place within the creek, with personal oyster floats off residential properties, and a commercial production facility located at the mouth of the creek (with thousands of oysters being grown in the vicinity). This is likely having a significant impact on water quality.
The Potomac River watershed, in the area where we are testing, is much more densely populated. Nutrient levels, such as phosphates and nitrates, might be higher due to higher concentrations of polluted runoff coming from suburban developments. There are also no oysters acting as a natural filtration system in this part of the watershed. It will be interesting to compare chlorophyll levels between these locations once enough data is retrieved and analyzed. We’ll keep you posted!
Grasses, Blue Crabs See Comeback
Surveys for both blue crabs and underwater seagrass found increases in population levels and acreage in the Chesapeake Bay this year.
The 2016 joint survey between the Maryland Department of Natural Resources and the Virginia Institute of Marine Science (VIMS) found that there are 35% more blue crabs in the Bay than this time last year. More specifically, the female population reached 194 million individuals, with overall numbers reaching 553 million.
Crab population numbers tend to fluctuate year-to-year, based on a number of factors, such as habitat loss, water temperatures, and harvest levels. The past two years have seen improvements to population numbers, but the blue crab is still considered to be in a state of recovery. Numbers have not reached 800 million, the number of blue crabs found after the first survey in 1988, in many years. With population fluctuation in mind, experts at the Smithsonian Environmental Research Center stated that this year’s good news does not necessarily mean that stricter harvest restrictions in Virginia and Maryland should be lifted. (SERC, 2016).
Crab population levels can be linked to seagrass acreage in the Bay. Seagrass provides habitat and protection for juvenile blue crabs. In past years, seagrass loss has been one predicted cause for blue crab population declines. The most recent survey from VIMS found that Bay seagrass acreage in 2015 was the highest it has been in 30 years. Perhaps these increases correlate to blue crab numbers.
The VIMS survey counted 91,631 acres of seagrass, up 21% from the 2014 survey, and 140% from the first survey in 1984. For more information on growth rates in specific regions (Upper Bay, Mid Bay, Lower Bay), please see the Bay Journal.
