Chesapeake Bay
Mixed News from Blue Crab Survey

Each year the Maryland Department of Natural Resources, in partnership with UMCES and VIMS, conducts a winter dredge survey to estimate blue crab population numbers in the Chesapeake Bay. The survey gathers information on the total number of crabs, as well as the number of adult males, female crabs of spawning age, and juveniles. Total numbers give an indication of the current health of the blue crab population; the number of juvenile and female crabs of spawning age give an indication of future conditions. Spawning age females impact the beginning of the coming harvest season (April to July, now ongoing); juvenile crabs impact the harvest further down the line.
The 2017 survey brought mixed results. Total population decreased in number from last year’s 553 million count to 455 million.
Population numbers of spawning age females must meet a certain threshold to be considered sustainable (70 million). Virginia and Maryland have also adopted a population target of 215 million. This year’s count of females of spawning age was the highest since the survey was first undertaken in 1988, with a number of 254 million, well above the target number. This number increased from last year’s count of 194 million.
Survey results were not so good for adult males – which decreased by 16% – nor for juveniles. The number of juvenile crabs estimated in this year’s dredge survey was the fourth lowest number ever recorded. This decrease could impact the second half of this year’s harvest (Maryland’s crabbing season runs until December 15; Virginia’s season closes November 30). Scientists on the Chesapeake Bay Stock Assessment Committee are likely to release updated management recommendations to Maryland and Virginia later this summer.
Note: To read more about where the winter dredge survey takes place, and how the survey is conducted, please read this piece from Maryland’s Department of Natural Resources.
Sources: WVTF Public Radio, Maryland DNR
Climate Change in Delaware Bay
Ted Williams wrote a piece this week for Yale Environment 360 on the impact climate change is having on the Delaware Bay. Although this estuary is much smaller than the Chesapeake Bay (782 square miles to the Chesapeake’s 64,299 square miles), the two watersheds have a lot in common, in terms of geographic location, features, and marine and shorebird species. The changes Williams sees occurring in Delaware Bay are either issues we are currently seeing in the Chesapeake, or could be a sign of changes to come.
The most dramatic change occurring in the Delaware Bay is the loss of tidal wetlands due to sea level rise and erosion. The watershed is losing an acre a day of its wetlands. With rate loss expected to increase, by 2100, 90% of these wetlands may be lost.
Wetland loss impacts lifecycle processes of several species. Atlantic menhaden larvae require tidal marshes. Ribbed mussels (an important filter feeder in the Bay) form tight-knit clusters in marshes; erosion makes the mussels more susceptible to predation.
Sea level rise contributes to beach erosion and shoreline tree loss. Horseshoe crabs, which use beaches in the Delaware Bay watershed as spawning grounds, are losing their grounds to sea level rise. Some shorebird species dependent on horseshoe crab eggs, such as the red knot, are at risk from these environmental changes.
Certain species in the Delaware Bay may see short-term benefits from climate change. With fewer freezes occurring, Delaware Bay oysters can survive in intertidal zones. However these now warmer zones are hosts to diseases (MSX and Dermo) and predators (oyster drills).
Warmer waters exacerbate pollution issues. Nutrients build up, dissolved oxygen can decrease, and algal blooms can increase in frequency.
The Chesapeake Bay is also experiencing shoreline loss and erosion. Places like Dameron Marsh and Hughlett Point in Virginia have been discussed here previously in terms of erosion and sea level rise. Naturally warmer waters in the Bay mean that diseases such as MSX and Dermo have been impacting native oysters for decades. It will be interesting to see how warmer waters -associated with climate change- host new or increased populations of pests/predators for our oysters. Ocean acidification may also be a concern. The changes occurring between species relationships, such as between Delaware’s red knot and horseshoe crab, will certainly be something to look out for in this watershed.
To read Ted Williams’ article, please visit e360.yale.edu.
Chesapeake Bay Report Card Released
The University of Maryland’s Center for Environmental Science (UMCES) has issued their annual report card on the health of the Chesapeake Bay watershed for 2016. This report examines several factors, including water quality, fisheries, and vegetative growth. Contributing factors are examined individually and the Bay is given an overall score based on these factors. This year, UMCES awarded the Bay watershed a C grade for the 2016-reporting year. While the letter grade remains unchanged from former years (going back to 2012), Bay health has improved by 1% since 2015- up to 54%.
This year’s online report is somewhat more interactive than in previous years, and includes some great graphics and graphs comparing Bay health indicators over time. I encourage readers to check out the report themselves here, however, to sum up these individual indicators:
- Overall health improved in certain segments of the Bay, most noticeably in the Lower Bay (adjacent to Virginia’s Middle Peninsula and Virginia Peninsula on the Western shore).
- Dissolved oxygen levels remained at relatively good levels throughout 2016. Dissolved oxygen levels are a major concern in the mainstem of the Bay during the summer months, when water temperatures rise, water is still/stagnant reducing the mixing of fresh and saltwater, and nutrient pollution contributes to algal blooms. These factors reduce oxygen levels needed by marine species.
- Total nitrogen decreased slightly from 2015. The best results were seen in the Lower Bay (which scored highest for overall health), and in the James and Rappahannock Rivers (which feed directly into the Lower Bay). Total nitrogen levels were highest in portions of the Bay adjacent to the Lower Eastern Shore and in the Upper Bay. Higher nutrient levels seem to correlate with the location of big agricultural regions. Agricultural runoff from poultry farms on the Eastern Shore and from the ag-rich northern reaches of the watershed in Pennsylvania and Maryland are likely major contributors to these higher nitrogen levels. The Potomac River also scored poorly for total nitrogen, likely due to a mix of agricultural runoff and urban/stormwater runoff.
- Total phosphorus levels were good overall. The mainstem of the Bay scored the highest, while certain tributaries -the James and York Rivers – had poor scores.
- Chlorophyll a levels were poor throughout the Bay, scoring a D in all but the Upper Bay and Lower Eastern Shore (C), and the James River (B). UMCES attributes high chlorophyll a levels to elevated nutrient availability.
- Water clarity overall was poor or very poor throughout the Bay. The only exception was the highest rated Middle Bay, which received a C score.
- Aquatic grass abundance continues to be an issue in the Bay. Overall, acreage of submerged aquatic vegetation has steadily declined since the mid-to-late twentieth century. Certain areas have seen improvements since 2012. The Rappahannock River, Lower Eastern Shore and Upper Bay scored the highest for aquatic grasses, with a B grade. I cannot comment on the other portions of the Bay, but the Rappahannock River ranking is consistent with what we have been observing where we take water samples – in Virginia’s Antipoison Creek and Little Bay – where we saw Bay grasses return last spring. These grass beds show signs of returning this year.
- The benthic community refers to bottom-dwelling and filter-feeding organisms. In the Chesapeake Bay, the benthic community includes (but is not limited to) bacteria, worms, clams and oysters. I believe the oysters scored in this report refer only to native oyster populations. Overall, the benthic community had a decreased score from the previous two years. All but the Lower Eastern Shore (B) and the Lower Bay (A) scored low. The Middle Bay and Potomac River had very poor scores. The benthic community is impacted by nutrient, sediment and dissolved oxygen levels. The community fared best where both total nitrogen and dissolved oxygen levels also scored well (the Lower Bay).
- Blue crabs scored very well throughout the Bay (A), relating back to 2016 survey results.
- Bay anchovy and striped bass also scored an A throughout the entire Bay. Conditions for these indicators have been consistent since 2012.
Conditions in the Lower Bay are consistent with what we have been seeing at Antiposion Creek (at the very tip of the Northern Neck where the Rapphannock River meets the Bay; the Rapphannock River is the dividing line between the Northern Neck and Virginia’s Middle Peninsula)- aquatic grasses are returning; the crab population was abundant last summer, according to local watermen; our nutrient levels coming back in our sample analysis show a generally healthy watershed.
Agriculture is still a major land use in the Lower Bay watershed. However, it would be interesting to study how land use in the Lower Bay has changed from agricultural or commercial waterfront operations to residential, compared to the agricultural areas in the Upper Bay and Eastern Shore, where overall health was poorer. Perhaps this land use change, if the difference is significant enough between the Upper and Lower Bay watershed, is influencing health indicators. The Lower Bay has also seen an influx of commercial and recreational oyster production in its waters (something that has not been adopted to the same extent in Maryland). This too is likely impacting nutrient levels in the Lower Bay.
Proposed Federal Budget Cuts Threaten Chesapeake Bay Restoration
The Office of Management and Budget recently released proposed budget cuts to certain federal agencies for Fiscal Year 2018. Among these proposed cuts is a $68 million reduction in funding for the Chesapeake Bay Program (CBP), an EPA program office that partners with Bay states and agencies to restore and protect the Chesapeake Bay.
The CBP oversees the Bay Watershed Agreement, and works with states to meet watershed cleanup goals laid out in this agreement by 2025. To meet 2025 goals, the CBP has been creating two-year work plans since the agreement was signed in 2014. These plans lay out specific objectives for fish and shellfish species, wetland and stream restoration, and submerged aquatic vegetation acreage; the plans address issues such as climate change, land use, and pollution.
Should the EPA have to cut funding for the Chesapeake Bay Program from $73 million to $5 million, Bay restoration will be largely left to the states (VA, MD, WV, PA, DE, NY and the District of Columbia). With eight years left in the Watershed Agreement **, and while the Bay still only meets a grade of C- (Chesapeake Bay Foundation, “State of the Bay,” 2016), reductions in federal funding would risk state and District programs aimed at Bay restoration and conservation, and could setback achievements made under the Watershed Agreement thus far.
** The Watershed Agreement lays out watershed cleanup goals until 2025. I would like to stress that goals may not be met by 2025, and even after this date, watershed protection programs must be left in place in order to preserve any cleanup goals made.
Environmental Bills in VA General Assembly 2017 Session Will Focus on Water Quality, Fisheries
I’ve been looking into which environmental bills and resolutions will be coming up at the 2017 Regular Session of the Virginia General Assembly. The state House and Senate will be meeting in exactly two weeks, on January 11. Several of the upcoming bills deal with water quality issues, as well as fisheries and habitat of tidal water. I’ll outline these proposed bills below, sorted via bill subject, and over the next few weeks, post updates on the states of these bills.
*Note: HB refers to House Bill followed by it’s number ID, SB refers to Senate Bill
Waters of the State, Ports, and Harbors
HB 1423/ SB 818: This bill addresses water quality in the Potomac River Watershed by designating the Virginia Department of Environmental Quality (DEQ) to 1. identify point sources when combined sewer overflow outfalls occurs, discharging untreated wastewater into the Potomac River or its tributaries and 2. gives the DEQ the responsibility of following up with owners of these discharge facilities to come up with action plans to reduce combined sewer outfalls. By doing so, the state will be acting in compliance with the Clean Water Act and the EPA’s Combined Sewer Overflow Control Policy (owners of combined sewer overflow sites must be in full compliance with this federal regulation by July 1, 2027).
A combined sewer system is when wastewater and stormwater are carried to a water treatment facility using a combined system of piping (in a separate sewer system, only wastewater is treated; stormwater flows directly into nearby streams). During periods of heavy precipitation, combined sewer systems can easily be overtaxed, leading to overflows of untreated water into streams and rivers. To my knowledge, only three major cities in Virginia still have this combined system and of these, only the city of Alexandria falls within the Potomac River Watershed. Treatment centers in this area would be subject to HB 1423/ SB 818.
Therefore, related to this last bill is SB 819, which if passed, would require the City of Alexandria to assess discharges from its Combined Sewer Outfall Number 001 (which discharges into the Potomac River) by January 2029. The City of Alexandria would have to submit this assessment to the State Water Control Board, and include an outline of actions and control technologies that must be adopted to prevent overflow discharges to the Potomac River.
HB 1454 would designate a stretch of the James River as part of the Virginia Scenic Rivers System. When the General Assembly designates a river, or sections of a river, as part of the Scenic Rivers System, it means it possesses “superior natural and scenic beauty, fish and wildlife, and historic, recreational, geologic, cultural, and other assets” (Code of Virginia, 10.1-400 Definitions). From my research, I cannot tell that this offers any kind of direct additional protection of these waters or habitats, but the designation may be important for outside conservation efforts.
Water and Sewer Systems
HB 1460 addresses the regulation of private wells, and would allow Stafford County to set standards for the construction or abandonment of private wells. Stafford County would join a growing list of state counties already able to set stronger regulations for their private wells. While this is primarily a public health issue, abandoned wells can impact groundwater, which eventually seeps into bodies of water.
Fisheries and Habitat of Tidal Waters
SB 820 would impact the Virginia Marine Resources Commission’s (VMRC) management of the menhaden industry. The bill would require the VMRC to implement the Interstate Fishery Management Plan for Atlantic menhaden and adopt regulations to manage the industry.
Atlantic menhaden can be found along the North American coast, including the Chesapeake Bay Watershed. As these fish are used for a variety of purposes, they have a long history of being overfished. Menhaden are used as bait for other fisheries (including the crabbing industry), and for fish meal and the production of fish oil. Protecting the stock of menhaden in Virginia protects a number of fishery-related industries.
UMCES Gives a C Grade for 2015 Bay Health in Latest Report Card
The University of Maryland’s Center for Environmental Science (UMCES) recently released their report card on the health of the Chesapeake Bay for 2015. The Bay watershed received a grade of a C, which in comparison to past years, is pretty good. Last year’s grade was a D+; the Bay has not received a grade at or higher than a C since 2002.
The score is calculated by analyzing measurements and factors throughout the different segments of the Bay such as streamflow, fish populations, water clarity, levels of nutrients (total nitrogen and phosphorus), acreage of underwater grasses, types and levels of benthic macroinvertebrates, levels of dissolved oxygen and chlorophyll. Each of the following segments of the Bay receives a grade, and the overall score is an average of these areas (individual grades can be found on page 4 of the report).
The segments of the Bay that were analyzed and scored are:
- Upper Western Shore
- Upper Bay
- Patapsco and Back Rivers
- Lower Western Shore (MD)
- Upper Eastern Shore
- Patuxent River
- Choptank River
- Potomac River
- Lower Eastern Shore (Tangier)
- Rappahannock River
- Mid Bay
- York River
- Lower Bay
- James River
- Elizabeth River
Improvements were found for almost all of the measurements listed above, compared to recent years. Total phosphorus levels in the Bay, however, increased from last year, despite models showing a decrease in phosphorus loadings from tributaries. Further study is needed to explain this.
UMCES points out that only two other years – 2002 and 1992 – had scores as good as 2015. However, 2002 and 1992 were drought years, while 2015 was not. (Drought years are generally good years for water clarity, and nutrient and sediment levels, as there is less runoff entering and polluting the Bay and Bay tributaries). So a question this latest report leaves us with is: Is water quality in the Bay improving? Or is the higher score attributed to other factors, such as the milder water temperatures of last summer?
My Experience at UMCES: Chesapeake Biological Laboratory
By Libby Warner
The University of Maryland Center for Environmental Science’s (UMCES) Chesapeake Biological Laboratory (CBL) on Solomon’s Island is a research facility where scientists study various aspects of ecosystems, including restoration ecology, toxicology, and fisheries. On Monday, May 16th, I had the opportunity to visit the center and learn about the different projects taking place on a very informative and inspiring tour given by the CBL Director, Dr. Thomas Miller. Upon arrival, I immediately was struck with the beauty of the location. Red brick buildings with many windows overlook the Patuxent River, which feeds into the Chesapeake Bay. There is a grand, gated-off research pier that extends out into the river and contains a Pump House, which transfers water to various laboratories for testing.
The first stop we made on our tour was the Nutrient Analytical Services Laboratory that tests water quality. This laboratory consists of approximately seven full time scientists whose job is to run water samples through extensive tests that indicate the levels of various chemicals such as phosphorus or nitrogen. These samples can come from a variety of places, ranging from creeks to oceans, and therefore the analysis of these water samples varies. There are two primary methods used for these chemical tests. One method involves a spectrophotometer that relies on robotics and allows very small water samples to be used. The other method is less advanced and has existed since the 1970’s. It involves a complex tubing mechanism that relies on a very specific air pressure system with air bubbles existing every few centimeters in the tubes. This method requires larger water samples, but is beneficial in that it helps the operator gain a better understanding of how the system works. In some instances, it also gives a more accurate reading than the robotics system.
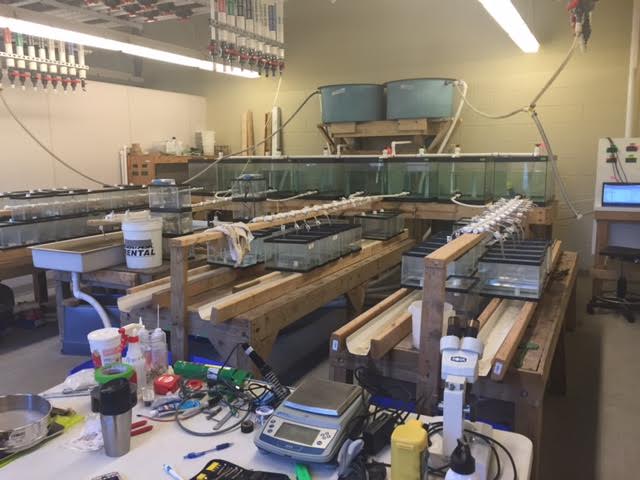
The next stop we made was in the “crabs on acid” laboratory. This lab is used for research on the effects of ocean acidification on blue crab populations in the Chesapeake Bay. A PhD candidate, Hillary Glandon, conducts this research. There are a few large tanks hooked up to the piping system, which collects water from the Patuxent River. The piping system has two pipes, which are alternatingly utilized to prevent the buildup of sediment and barnacles. The large tanks of river water in the laboratory act as different treatment groups, each with a different pH, which is controlled by adding different amounts of CO2. Each large tank feeds into multiple smaller tanks, which host the blue crabs. Originally, the proposed thesis was to determine the effect of ocean acidification on crab shell growth. However, with blue crab shells being difficult to measure due to the molting process that they undergo, Hillary altered her experimental question and is now studying the effect of acidification on blue crab respiration rates. (Lab pictured below).
After our stop at the blue crab laboratory, we went to a laboratory that measures methane levels in samples of water from the tropics. Another UMCES graduate student pursuing her PhD, Hadley McIntosh, conducts this research. These specific laboratories were a few of the many sites of research at UMCES. There are approximately 20 graduate students currently attending the university in addition to at least a dozen other full time employees who help provide nutrient analytical services. An interesting statistic regarding this gradate program is that about 65% of the students are women.
Overall, this visit inspired me, not only as a science student, but also as a member of the millennial generation. We are a generation of rising world leaders and it will be our responsibility to restore our planet’s environment after the damage it has received from prior generations. Research facilities such as this one on Solomon’s Island give me hope that, with the existence of strong, innovative scientific communities such as this one, we may have a shot at a brighter future.
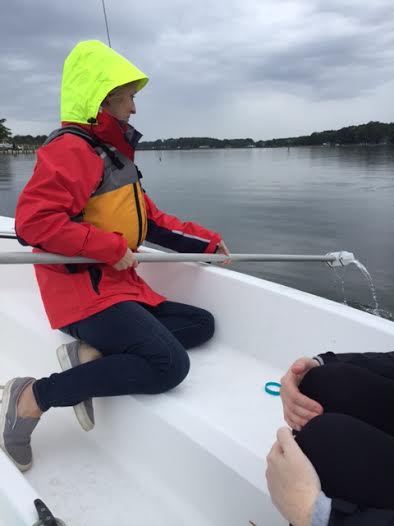
The author, Libby Warner, our new contributor to the blog, pictured below, collecting water samples on the Chesapeake Bay:
American Farm Bureau Plans to Bring Chesapeake Bay Case to Supreme Court
This summer we shared the rulings from the Third Circuit Court of Appeals on the American Farm Bureau Federation (AFBF) and allies vs. the Environmental Protection Agency (EPA) and Chesapeake Bay Foundation (CBF). See here.
The most recent ruling from the Third Circuit was the result of an appeal from the AFBF of a lower court decision upholding the legality of the EPA’s Chesapeake Bay Clean Water Blueprint in 2010 (the Blueprint that sets Total Maximum Daily Loads or TMDLs for the Bay states and Washington, D.C.). While all Bay states and D.C. support this Blueprint, and are committed to cleaning up their watershed, pushback is coming from interest groups and states outside of the Bay watershed. These groups originally sued the EPA for overstepping on an issue that they claim should be left up to the states. The EPA argues that it has the right and responsibility to uphold the Clean Water Blueprint under the Clean Water Act. Groups, such as the AFBF, fear that the EPA’s role in the Chesapeake Bay Watershed will set a precedent, allowing the federal government to intervene in the cleanup of other major watersheds around the nation, such as the Mississippi River Watershed. Big agriculture groups fear that they would be a major target of watershed cleanup plans. As such, the AFBF and its allies plan to appeal the Third Circuit court decision, and bring the case before the Supreme Court.
Bay Grass Acreage Up From Last Year
The abundance of total underwater seagrass in the Chesapeake Bay is up 27% from last year. Underwater grasses increased by thousands of acres across all four water ranges (from freshwater, slightly salty, moderately salty, to very salty) in the Bay watershed. There are currently an estimated 75,000 acres of underwater grasses in the Bay, up from 59,711 acres in 2013. The increase in acreage in each salinity zone (amount of salt in the water) is represented in a table below.
While this increase is a vast improvement from previous years, the Bay needs to have an additional 15,000 acres of underwater seagrass to meet 2017 restoration goals, and a further 40,000 acres to meet 2025 goals, set by the Chesapeake Bay Program (CBP). Beyond 2025, the CBP ultimately aims to restore 185,000 acres of underwater grasses in the Bay. Underwater seagrass acreage is gradually increasing in the Bay, but over 100,000 additional acres must be restored to meet CBP standards.
| Zone | 2013 Seagrass Acreage | 2014 Seagrass Acreage | Zone Goal Achievement (%) |
| Tidal Fresh Salinity | 1,320 | 15,305 | 74% |
| Oligohaline Salinity (Slightly Salty) | 1,800 | 7,413 | 72% |
| Mesohaline Salinity (Moderately Salty) | 11,850 | 37,260 | 31% |
| Polyhaline Salinity (Very Salty) | 1,154 | 15,857 | 47% |
Bay grass acreage can fluctuate from year to year, due to die-offs from heat waves or major storms, such as Tropical Storm Lee in 2011. Long-term threats to underwater grasses, which have resulted in decades of declining seagrass abundance in the Bay, include nutrient and sediment pollution. Nitrogen, phosphorus, and sediment runoff from agricultural activity and urban stormwater runoff contribute to the declining health and die-off of Bay grasses.
Underwater seagrass plays an important role in the Chesapeake Bay ecosystem. Seagrass provides habitat and sanctuary to various underwater species, such as juvenile blue crabs and finfish. Grasses are able to improve water quality by filtering runoff in the Bay and taking up nutrients that would otherwise contribute to pollution in the watershed. Seagrass protects shorelines from erosion by absorbing wave energy and keeping sediment in place.
The 16,000-acre increase in underwater seagrass abundance in the Bay between 2013 and 2014 is great news. This is a trend that I hope to see continue in years to come. However, restoration, at levels expected by 2025, will not be possible without the Bay states’ cooperation in implementing and enforcing regulations that reduce nitrogen and sediment runoff into the watershed. While 2014 numbers are an improvement from previous years, Bay acreage will continue to fluctuate in years to come, and the only way to create a long-term positive trend in future seagrass abundance is to significantly reduce nitrogen and sediment pollution in the Bay.

Recent findings on Bay seagrass acreage come from the Virginia Institute of Marine Science (VIMS), which has released their annual report on underwater seagrass abundance in the Chesapeake Bay for 2014, (http://www.vims.edu/newsandevents/topstories/sav_2014_report.php).
For more information on underwater seagrass, please see Part III of our Phosphorus in the Chesapeake paper here: https://beyondthebayblog.com/2015/05/07/phosphorus-in-the-chesapeake-part-iii/.
A Review of Virginia’s TMDL Assessment
By Neil Saunders
Given the EPA’s recent interim assessment of the Bay States’ ongoing implementation of the Chesapeake Bay TMDL and the Third Circuit’s affirmation of the legality of the Bay TMDL, it is worthwhile to take a closer look at the findings of Virginia’s water quality assessment. While this assessment is relevant to the Chesapeake Bay TMDL, in that any sub-watersheds belonging to the Chesapeake watershed apply to the Bay TMDL, it encompasses all of the waterbodies in Virginia- not only those belonging to the Bay watershed.
Virginia may be on track towards Bay TMDL implementation, but current water quality in the state is still far from healthy. According to Virginia’s Department of Environmental Quality (“DEQ”) 2014 water quality assessment, a significant percentage of rivers, lakes, and estuaries are “impaired” in three out of the six designated uses in Virginia: recreation, aquatic life, and fish consumption.
The assessment sites the presence of E. Coli from agriculture, urban runoff, leaking sanitary and storm sewers, and domesticated animals as primarily responsible for the impairment of the recreation use. For aquatic life, low levels of dissolved oxygen concentration and nutrient enrichment are the primary cause of impairment. Specific causes for impairment of fish consumption are mercury and PCBs (polychlorinated biphenyls). The remaining designated uses are shellfishing, public water supply, and wildlife, which have a much lower percentage of impaired waterbodies.
Additionally, a vast majority of lakes (81%) and estuarine waters (75%) tested are impaired for at least one designated use. River waters have a lower percentage of impairment (17%), but this figure does not take into account the 78% categorized as non-assessed due to insufficient data. DEQ utilizes two methods of data collection: DEQ-approved monitoring, which includes all monitoring performed by DEQ or individuals approved by DEQ, and lower quality, DEQ-non-approved monitoring, which includes outside data collection by citizen groups, the private sector, and other government organizations. Both types of monitoring play an important role in DEQ’s overall assessment methodology (p. 4). It is not clear from the report, however, why so much data for river waters are insufficient to assess.
The VA DEQ 2104 assessment is based on six years of monitoring between 2007 and 2012. The Clean Water Act requires every state to submit to the EPA a biennial review describing the quality of their navigable waters. Virginia uses a monitoring schedule that covers 1/3 of all waters every two years, so that all waters are monitored within a six-year period.
Unlike the EPA interim assessment, however, this water quality assessment provides a more accurate and immediate sense of what the Virginia’s water quality was in 2012. As the information in this report shows, despite Virginia staying on track for the most part to meet the Bay TMDL implementation targets, there is still a long way to go and a lot that needs to be done for the water quality to actually improve.
One of the biggest areas for improvement is monitoring. As stated earlier, almost 80% of river waters throughout the state are categorized as “non-assessed” due to lack of sufficient data. As a result, it is uncertain what percentage of these rivers are meeting their respective water quality standards, and what percentage are impaired or threatened. Unfortunately, a lack of sufficient monitoring- a problem which exists in most states- is more easily fixable in theory than in practice: understaffing at the agencies charged with conducting the water quality assessments as well as budgetary constraints severely limit the amount of waters that can be properly assessed.
One potential way in which monitoring can improve is through Virginia’s citizen monitoring programs. DEQ relies on citizen monitoring data to supplement its own data collection, and offers grant money to organizations through the state’s Citizen Water Quality Monitoring Grant Program. While DEQ cites 120 such organizations as providing data for the current assessment, not all data collected could be used because they did not meet DEQ’s assessment methodolgy or procedures. If more citizen-collected data could be used by DEQ, through additional citizen involvement and proper training, more waterbodies could be assessed, which would lead to more accurate assessments of water quality and more accurate changes to address water quality conditions.
Improved monitoring may not directly address other issues plaguing water quality, such as excessive bacteria or nutrient enrichment, but with more accurate assessments, Virginia can more effectively manage its regulatory framework to achieve greater reductions in pollution and better meet the goals of the Clean Water Act and Bay TMDL.
The information in this post was acquired from the report available on VA DEQ’s website: http://www.deq.state.va.us/Programs/Water/WaterQualityInformationTMDLs/WaterQualityAssessments/2014305(b)303(d)IntegratedReport.aspx#factsheets.
